
Where Distributed Tracing Breaks
Across a queue, join with links rather than parent-child
In one line
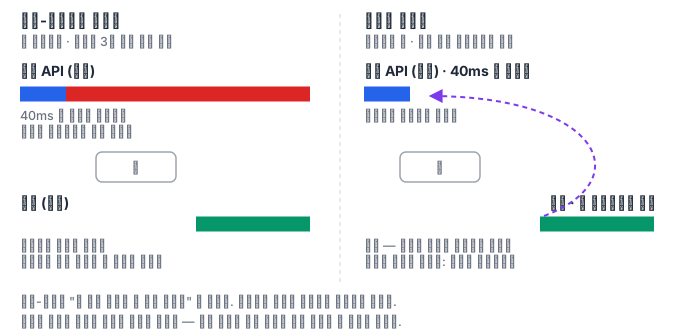
Across a queue, connect with a link rather than parent–child. Parent–child means "this job is not done until that job is done," but a producer does not wait for consumption to finish.
Why this was needed
After we put a queue into the order API, the traces became strange. The response went out to the user in 40 milliseconds, yet the root span on screen showed 3 seconds. The person who instrumented it, with the good intention of "wanting to see one order processed all the way through as a single trace," had made the consumer-side span a child of the producer span.
Parent–child does not mean that. A parent span ends only after all its children have ended. So the producer, having already sent back its response, sits unable to close its span, and on a day when the queue backs up, that span stays open for minutes. Fan-out makes it worse — if one order creates five messages and one of them creates three more, a single trace grows to thousands of spans and the backend starts giving that trace special treatment.
How it works
OpenTelemetry has the link (Link) for exactly these places. A link is the relationship "this span is causally connected to that span, but that span does not wait for me." When you create a span you give it a list of links, and you can attach attributes to each link. The detailed definitions are in the Trace API specification and the Traces concept docs.
| Way to connect | Meaning | Where to use |
|---|---|---|
| Parent–child | The parent waits for the child | A synchronous call within the same request |
| Link | There is causality but no waiting | Across a queue, batch processing, reprocessing |
| Do nothing | The relationship is not recorded | Work that is truly unrelated |
So the basic form for the queue lab is this. The producing side creates a span for putting in the message and sends that span's id along in the message. The consuming side starts its span as the root of a new trace, but builds and attaches a link using the id that came in the message. Then the producer trace ends right along with the user response, and the consumer trace lives only for its own time. The two traces are connected by the link, so you can follow it later.
Batch consumption, which takes several items out at once, is drawn as a single span with several links. If you create a span per message, the one piece of work that processed the batch gets scattered, and if you create just one with no links, you cannot tell which messages were in that batch. The messaging semantic conventions say to write messaging.batch.message_count in this case — there is a table in the messaging span conventions.
The time spent waiting in the queue is not captured by any span on its own. You have to send the produce time along in the message and have the consumer span write that difference as an attribute. With this value you can tell "processing is slow" from "the queue is backed up," and the two are fixed in completely different ways.
The span kinds are also set by the same document. A span that creates or sends a message is PRODUCER, and a span where the application processes a message is CONSUMER (a receive that only fetches is CLIENT). This value is not decoration but the clue by which analysis tools interpret relationships between traces, so if you attach it without rules, the tools cannot recognize the queue.
You can attach attributes to a link, and you should. With only the link, the fact that "they are connected" remains, but why they are connected does not. If you write in the link attributes whether it was because of a queue message, a reprocessing, or being in the same batch, a person can read it later.
Let us be clear about what this module does not cover. Reading the pieces of the HTTP header traceparent to join a broken chain is the propagation lab's job, and passing the context between threads or Tasks inside one process is the context boundary lab's job. What is decided here is the judgment of recognizing the places where connecting with parent–child is not right, and changing them to links.
We also write down what the lab environment cannot judge. The Pod has no broker, no Collector, and no tracing backend. So what shape a backend screen draws for links, and whether tail sampling keeps the two linked traces together, cannot be confirmed here. The queue is imitated with a single file, and all judgments are made from the structure and attributes of the JSONL dump the SDK exported. Elapsed times vary by machine, so we look at them only as relationships, not absolute numbers.
What it looks like in the field
The most common signal is that "the root span's time differs from the time the user waited." If the response went out in 40 milliseconds and the trace says 3 seconds, almost always an asynchronous job has been hung on as a child. You cannot measure latency with such a trace — because the time the user experienced and the time the system worked are lumped into one number.
Another is the symptom that "only a certain trace will not open." In a system that has connected fan-out with parent–child, when one order grows to thousands of spans, the backend truncates that trace or the screen freezes. If you change to links, each trace stays small, and the whole journey can be stitched back together by following the links. In the last step of the lab, you do that stitching yourself.
What you will do in the next lab
You put messages into a very small queue made of a single file and take them out later to process. First you connect producing and consuming as parent–child and see in the dump how the root span swells and where the gaps appear. Then you change the consuming side to the root of a new trace and connect with a link. You draw batch consumption as a single span with several links, leave the time waited in the queue as an attribute, attach span kinds and messaging attributes by the conventions, and write the reason on the link. Finally you apply it to fan-out, where one creates many, and follow the links to stitch one order's journey together beyond the trace.