
Where Distributed Tracing Breaks
Client Time Versus Server Time
In one line
An outgoing call is measured from both sides. The difference between the client span and the server span is "time spent outside the server," and if you do not put that time inside the span boundary, the slowness users experience is not in the trace.
Why this was needed
This is the most common deadlock in incident meetings. The downstream team says "our p99 is 20 milliseconds," and the upstream team says "when we measure, it's 300 milliseconds." Both are looking at their own dashboards and both are right. They are simply measuring different intervals.
What the server measures is the time the request handler was open. Before it, there is the time to get a connection, serialize the request, send the bytes, and wait for a turn in the other side's thread pool. After it, there is the time to receive the response and deserialize it. This interval, visible only from the client, is often most of the time the user actually waited.
Worse is connection pool wait. When the pool is empty, it waits before even sending the call, yet a lot of instrumentation starts the span after getting the connection from the pool. Then that wait is in no span. The trace shows only 30-millisecond calls lined up, but the root span is 2 seconds. A person looks at the "empty interval" and cannot find the cause.
How it works
OpenTelemetry uses SpanKind.CLIENT for outgoing calls and SpanKind.SERVER for the receiving side. The two are connected as parent–child in one trace, and they are a pair that measures the same logical job from different viewpoints. Looking at the subtraction of the two spans' times is the starting point of this lab.
Where to put the boundary is the heart of the design. The rule can be written in one line — from the moment the caller starts waiting for the response until the moment it has the response in hand is the CLIENT span. The time spent waiting to get a connection and the time rested between retries must be inside it for it to equal the time the user experienced. For retries, the shape that reads well is one child span per attempt with an outer span covering the whole.
A cut-off call leaves the pair mismatched. Even if the client gives up at 120 milliseconds, the server works through its 400 milliseconds to the end. Then the same trace keeps a 120-millisecond CLIENT span and a 400-millisecond SERVER span together. If you do not recognize this shape, you misread "the server span is longer than its parent" as an instrumentation bug. In reality it is a sign that resources are leaking — the server keeps producing a response nobody will read.
A cancellation must be recorded differently from an error. A connection dropped because a user closed the tab is not a failure of the service. If you raise the status to ERROR, the error rate swings with users' behavior, and alerts built on that metric wake people at dawn. OpenTelemetry's span status convention sets the status to three values, Unset, Ok, and Error, and leaves whether to raise it to an error up to the side doing the instrumenting. For a cancellation, it is easier to handle if you leave the status as it is and record it with attributes and events.
Attribute design is a cardinality problem. When you write the target of an outgoing call, if you put the address in as it is, order ids and Pod suffixes get mixed into the value. This is why the RPC conventions in Semantic Conventions keep rpc.service and rpc.method separate — which operation of which service it is has few kinds of values, and only then does aggregation work. Ids are not attribute values; they go down to events or logs when needed.
How to compute critical paths and repeated calls from a dump is covered by other labs in this path, and what to put in outgoing headers is covered by the context boundary lab in the certification course. What you do here lies between the two — where on the outgoing side to draw the span from and to, and what to attach to it, so that such calculations hold.
Finally, a single request calling the same target several times becomes visible only if there are client spans. If you instrument only the server side, there are merely six spans scattered downstream, and the fact that they went out of one request does not show in the upstream trace. If you attach the target and operation as low-cardinality attributes, counting how many times the same pair went out becomes one line of a query.
What it looks like in the field
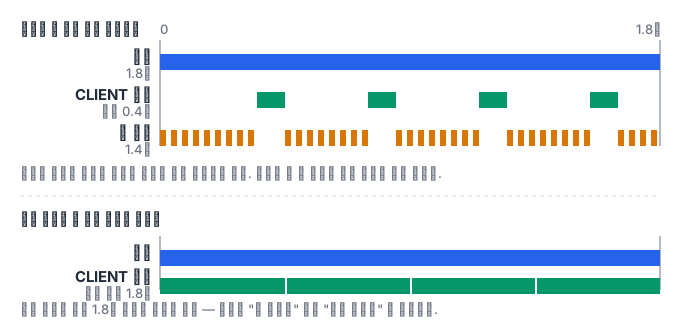
I once saw a trace like this in a payment latency investigation. The root was 1.8 seconds, but adding up all the child spans gave only 0.4 seconds. The remaining 1.4 seconds was in no span. The cause was that the connection pool size was 2 and one request was calling downstream eight times. Because the instrumentation started the span after getting the connection, the wait time had vanished entirely. A three-line change moving the span start in front of the pool acquisition made that 1.4 seconds show up on screen, and only then did the discussion move from "why is it slow" to "do we enlarge the pool or reduce the calls."
In another service, a timeout was hiding the problem, the opposite way around. Because the client timeout was 200 milliseconds, the dashboard's p99 always stuck at 200 milliseconds. When we looked at the server-side spans together, a 1.2-second SERVER span remained in the same trace. The client had given up and the server kept working, and that work piled up and made the requests that followed even slower. One query counting the mismatched span pairs became the basis for breaking this cycle.
What you will do in the next lab
You measure the same call on both the client and the server side to find the difference, and split that difference into queue time and the remainder. You build side by side the case where the connection pool wait is left outside the span and the case where it is put inside, and confirm how differently the same thing looks. You find and match the pair of a call cut off by a timeout across two dumps, and settle the rule for recording a canceled call differently from an error. Then you design the target-identifying attributes as low-cardinality and count the number of distinct values yourself, and expose a single request calling the same target six times with client spans alone. Finally, you write those rules in a file and apply them as they are to a second client.