
Where Distributed Tracing Breaks
Where should a span end?
In one line
You draw spans not at every code block but by what the next person who opens this trace will ask. Too few and you cannot tell where to look; too many and nobody ever opens it.
Why this was needed
A report came in that payment was slow, and when we opened the trace there was one span. Its name was POST /checkout and its length was 211 milliseconds. All you can read from that is "it took 211 milliseconds." You cannot tell whether the time went to reading the cart, whether the payment provider was late, or whether it went to looking up product prices twenty-four times inside our own process. The instrumentation was on, but it was instrumentation that could not answer any question.
So some teams went the other way. They put a span in each loop iteration, so one request became thirty spans, and for an order with two hundred products it was more than two hundred. The screen showed identical-looking bars running on endlessly, and in the incident meeting nobody scrolled to the end of that trace. The number of spans is both a storage cost and the reader's attention budget.
Both failures come from skipping the same question — what will we ask about this request later, and where must the boundaries be to answer that question?
How it works
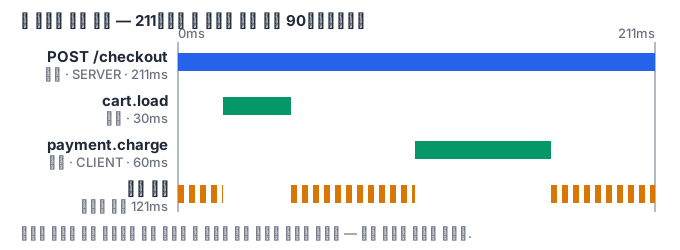
There is one number you can use when deciding boundaries. It is the time during which the parent span was alive that no child covered. In this article we call it the instrumentation gap. Children can overlap each other, so you measure with a union and subtract it from the parent's length; what remains is the gap.
POST /checkout  ├────────────────────────────────────────┤  211ms
  cart.load             ├──────┤                             30ms
  payment.charge                      ├────────────┤         60ms
  공백            ·······        ······              ······   121ms
A large gap does not mean it is slow; it means there is not yet a span in that interval. This distinction matters. Self time and the critical path are performance calculations that ask what is slow among spans that already exist, while the gap is a map pointing to places that have no instrumentation yet. The purpose of measuring the gap is not to rank things but to choose where to draw the next span.
The rules for drawing boundaries boil down to three.
| Rule | Meaning | When broken |
|---|---|---|
| Always a span at a process boundary | Split incoming requests and outgoing calls | You cannot tell whether the fault is someone else's or ours |
| Split the intervals with big gaps first | Uncovered time is exactly the time we do not know | Adding spans gives no answer |
| Fold repetition instead of making spans | As a count, a total time, and a maximum | Same-shaped bars cover the trace |
The third is what goes wrong most often in practice. If you wrap the repeating interval in one span and then attach count, total_ms, and max_ms to it as attributes, a single span can describe the whole repetition. If you keep only the average, the fact that one out of twenty-four was ten times slower disappears, so keep the maximum as well, and write what that one case was as an event. An event is a record attached to a single point in time inside a span, so it fits for keeping a particular moment within a repetition.
For marking boundaries you use SpanKind. A span that handles an incoming request is SERVER, a call going out of the process is CLIENT, and an interval split inside the process is INTERNAL. This mark is not decoration; it becomes the criterion for separating "the time we waited on others" from "the time we spent working." If the sum of CLIENT spans is large, we waited on others, and if INTERNAL is large, we did the work.
Finally, if you leave this judgment as a matter of personal taste, you will fight over it again at every review. If you write down the span cap per request and the allowed gap ratio in a file and have a machine read it, the same criterion is applied automatically when you instrument a new handler. Exceeding the cap is not always wrong, but just making people write one line explaining why they exceeded it removes "let's add spans first and see."
Let us also be clear about what cannot be judged in this lab Pod. Neither a collector binary nor a backend screen that draws traces exists in this Pod. So "is this trace pleasant to read on screen" you have to judge by eye, and what the grader looks at is the structure of the dump that writes spans out as JSONL — the number of spans, parent relationships, names, SpanKind, attribute keys, and the gap ratio. Absolute millisecond values change when the Pod is busy, so they are judged only as ratios.
What it looks like in the field
An order service spent months with only auto-instrumentation turned on. Auto-instrumentation creates spans at the HTTP entrance and in the database driver, so the traces did not look empty. But whenever you opened a slow request, half of it was always gap. That half was the stretch where the application code ran by itself, and it was not a place auto-instrumentation could see. Only after they started measuring the gap did "where should we put spans by hand" come out as a list.
There was an opposite incident too. A batch job created a span for every item, and normally there were ten items so nobody noticed. At month-end, when the items reached twenty thousand, a single trace became twenty thousand spans, and the collection side fell behind because of that one trace. The fix was not to delete spans but to fold them — they removed the item spans and left the processed count and the longest duration as attributes on a single batch span. The trace became readable again, and the one slow case remained as it was, as an event.
What you will do in the next lab
You receive order-processing code with not a single line of instrumentation and start from a one-span trace. You measure the gap to find the intervals with no instrumentation and split them to bring the gap below 5%. Then you turn the repeating interval into spans and count for yourself how many spans result, and fold the same repetition into attributes and an event to cut it down again. After marking boundaries with SpanKind, you write the span cap per request and the allowed gap in a rules file, build a small program that checks those rules, and run it on the dumps you made earlier. Finally, you instrument a second handler from scratch under the same rules.