
PCA — Prometheus Certified Associate
GPU and Serving Metrics — What DCGM Tells You and What It Does Not
In one line
The verdict people get wrong most often in GPU metrics is "this card is idle." For a card whose utilization is 0 but which holds 13.7 GiB of memory, which way do you count it — the answer is not one metric but looking at utilization, memory, and power together over the whole window.
Why this was needed
GPUs are expensive and do not increase easily. So you often have to judge "how many are needed," and if you look only at the dashboard's utilization then, you are always wrong. The measurements on this cluster are an example.
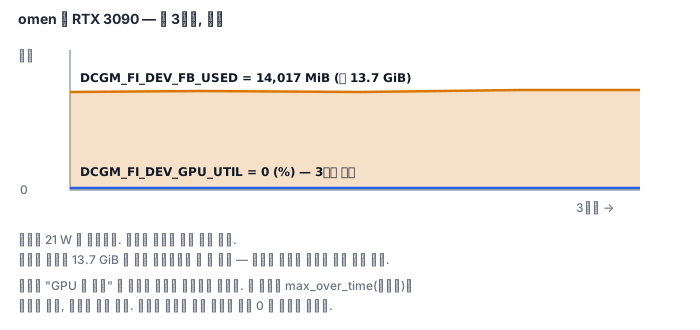
It really does no computation. But that 13.7 GiB cannot be used by other workloads. Even when a card is idle, the slot is not empty. If you count this state as an "idle GPU," capacity planning is wrong, and if you count it as an "in-use GPU," you cannot find the waste. You have to write down both.
How it works
dcgm-exporter turns the fields of the DCGM library directly into metrics. These are the commonly used ones.
| Metric | Type | Unit and meaning |
|---|---|---|
DCGM_FI_DEV_GPU_UTIL |
gauge | GPU utilization (%) |
DCGM_FI_DEV_FB_USED · FB_FREE |
gauge | Framebuffer used and free (MiB) |
DCGM_FI_DEV_POWER_USAGE |
gauge | Power (W) |
DCGM_FI_DEV_TOTAL_ENERGY_CONSUMPTION |
counter | Cumulative energy (mJ) |
DCGM_FI_DEV_SM_CLOCK |
gauge | SM clock (MHz) |
DCGM_FI_PROF_SM_ACTIVE |
gauge | Fraction of time warps were resident (disabled by default) |
It is interesting that energy is a counter. If you differentiate with rate(...[30m]) / 1000, you get watts,
and compared with the POWER_USAGE gauge at the same time, it is almost the same value (measured:
54.7 W versus 55.3 W). It is a rare place where you can see with your own eyes that the same thing can be measured as either a counter or a gauge.
For GPU_UTIL, the official DCGM field description is just one line, "GPU Utilization." If you want to know more about what it measures
and how, you have to look at the profiling metrics. The official documentation defines
PROF_SM_ACTIVE as "the fraction of time at least one warp was resident on an SM, averaged over all SMs," and adds, "active here does not
necessarily mean computing — a warp waiting for a memory request is also counted as active." That is why
utilization can look like 100% even when a single kernel uses only 1/5 of the GPU. However, in this exporter's
default configuration PROF_* is turned off, and there is also the restriction to data-center-class (Volta and later) cards.
Attribution labels are not guaranteed. dcgm-exporter asks the kubelet and attaches
exported_namespace, exported_pod, and exported_container, but depending on the node
configuration these labels can be entirely empty. On this cluster too, one of the four cards is
like that. A GPU without attribution is "a resource whose user is unknown," and cost allocation and reclamation verdicts
stop right there.
What it looks like in the field — serving metrics
An inference server cannot be judged by GPU metrics alone. GPU utilization looks like 100% even while the queue piles up and the first token is late. That is why vLLM emits serving-side metrics separately.
| Metric | Type | Meaning |
|---|---|---|
vllm:num_requests_running · vllm:num_requests_waiting |
gauge | Number of requests running and waiting |
vllm:time_to_first_token_seconds |
histogram | Time taken to the first token |
vllm:inter_token_latency_seconds |
histogram | Interval between tokens |
vllm:prompt_tokens_total · vllm:generation_tokens_total |
counter | Number of tokens processed |
vllm:kv_cache_usage_perc |
gauge | KV cache occupancy (1 is 100%) |
vllm:request_success_total |
counter | Number of finished requests, with a finished_reason label |
It is also good to know that a few names changed in the v1 engine. gpu_cache_usage_perc became
kv_cache_usage_perc, and the labels grew from model_name alone to two, model_name and engine.
In the source, counters are declared without a suffix and the client library attaches
_total — so if you grep the source and copy names down, you get it wrong.
The serving metrics in the next lab are not measurements. The vLLM deployment on this cluster is currently off with 0
replicas, so there are no metrics at all. To avoid pretending something exists that does not, we use
synthetic samples that only imitate the format and have attached the label source="synthetic" to every series.
The GPU, container, and node metrics are all real measurements, and only the vllm: family is samples.
What you will do in the next lab
With three hours of real measurements from four GPUs, you judge an "idle card," find the card missing its attribution label, derive average power from the cumulative energy counter and compare it with the gauge, and finally get the p95 of time to first token from the histogram of synthetic samples. At the end, you write in the report which parts are measured and which are samples.