
PCA — Prometheus Certified Associate
From the Side That Makes the Numbers — cAdvisor and node exporter
In one line
PromQL only picks and computes numbers that already exist. What those numbers count is decided by the exporter. Why cAdvisor's CPU is cumulative, why working set differs from RSS, and why limits are not in cAdvisor — from here on it is the exporter's side of the story.
Why this was needed
If you have ever been asked "CPU usage is 658855, is that a lot?", that person did not get
the query wrong; they did not know the kind of metric.
container_cpu_usage_seconds_total is a value that keeps adding up the CPU time a container has used since it was born,
so a long-lived container always wins. The magnitude tells you nothing, and
the slope is the answer.
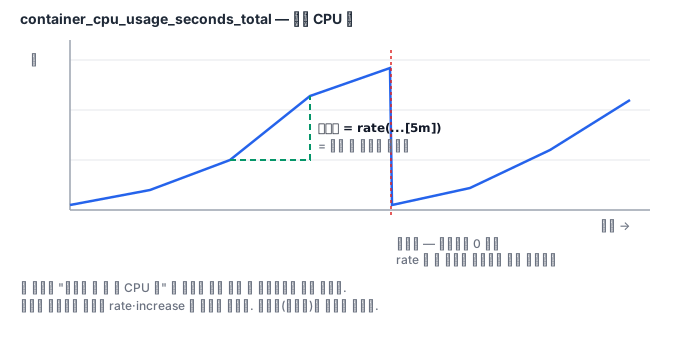
For the same reason, anything ending in _total is always read through rate or increase, and gauges like memory
are read as they are. A suffix is not a convention but a declaration of how to read it.
How it works
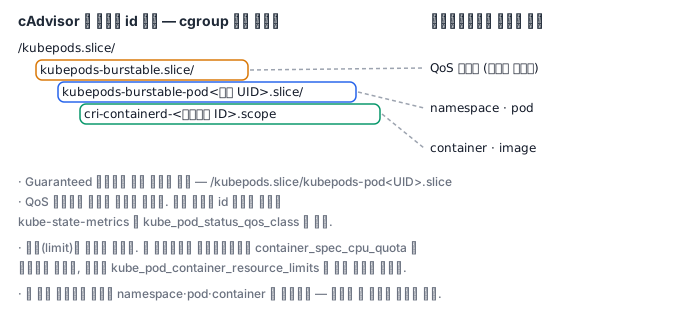
cAdvisor is inside the kubelet. If you scrape a node's /metrics/cadvisor, you get the cgroup statistics of every
container running on that node. The id label is the cgroup path itself,
and it contains the QoS class, the Pod UID, and the container ID.
All three memory metrics count different things.
| Metric | Meaning |
|---|---|
container_memory_usage_bytes |
Everything the kernel counts this cgroup as using |
container_memory_working_set_bytes |
Usage minus the reclaimable inactive file cache |
container_memory_rss |
Anonymous memory (memory with no file behind it) |
The calculation in the cAdvisor source is usage - total_inactive_file (cgroup v1) or
usage - inactive_file (cgroup v2), floored at 0 if negative. The value Kubernetes
uses to decide eviction is also this working set — the official documentation writes,
"the kubelet excludes inactive_file from the calculation, because it considers it reclaimable
under pressure." That is why you should look at working set rather than usage if you
worry about OOM.
The limit may not be in cAdvisor. cAdvisor's original output definitely has container_spec_cpu_quota,
but kube-prometheus-stack drops most of that family with its default metric_relabel_configs. So to see
"usage against limit," you have to join it with kube-state-metrics'
kube_pod_container_resource_limits on namespace, pod, and container. This is not peculiar to this cluster;
most stacks are like this.
The node exporter's CPU is cumulative time per mode. node_cpu_seconds_total is
one series for each core × each mode. You get utilization as "the fraction that was not idle" —
1 - avg(rate(...{mode="idle"}[5m])). If you use sum, it gets as large as the number of cores.
MemFree and MemAvailable are answers to different questions. free is memory nobody is using, and available is "the amount that can be handed to new work." Most of the page cache can be reclaimed, so available is much larger. On this cluster, cubi01 had free at 1.5 GiB and available at 9.0 GiB — if you set an alert on free alone, a perfectly healthy node cries every day.
What it looks like in the field
Alerts that treat CPU throttling as "an incident if greater than 0" are common, but when you actually measure,
most containers with a limit always experience throttling at the 0.0x% level. The measurements on this cluster
too had the highest container at 0.19% and the rest at 0. So the verdict is made with a ratio —
rate(throttled_periods) / rate(periods). And a container with no limit has no CFS
metrics at all. Nonexistent and 0 are different.
What you will do in the next lab
Three hours of real measurements from the 7-node cluster that runs this site are in the lab Pod's Prometheus. 674 series — real nodes, real containers, real GPUs. With that data, you measure the slope of container CPU, judge exceeding the limit by the throttle ratio, check which metric the difference between usage and working set equals, read the QoS class from the cgroup path, and join with kube-state-metrics to get utilization against the limit.