
OTCA — OpenTelemetry Certified Associate
Why memory_limiter Goes First and batch Goes Last
In one line
In a Collector configuration, the order of the processors you list in a pipeline is the order in which they are applied to the signal. It is a short sentence, but it makes a big difference in operations. memory_limiter goes first, batch goes last, tail_sampling goes before batch, and redaction of sensitive data comes after the processors that attach metadata.
Why this was needed
The SDK works even when it sends directly to the backend. Even so, there are five reasons to put a Collector in place.
- You change policy without redeploying. Sampling ratios, attribute filters, and retention targets are values you end up adjusting during operation. If they live in app environment variables, you have to roll out 20 services.
- You isolate the app from backend outages. When the backend slows down, the SDK's send queue fills up and app memory rises. With a Collector in front, it absorbs that pressure instead.
- You can switch backends. Using a different destination per signal or running two backends side by side is handled in one configuration file.
- You remove sensitive data outside the app. Incidents where tokens or emails get mixed into attributes will certainly happen. If you put a line of defense in the Collector, incident response becomes a configuration change rather than a redeployment.
- You can do tail sampling. To decide after seeing the outcome of a trace, the spans must be gathered in one place, and that place cannot be the app.
How it works
The configuration has six top-level sections: receivers, processors, exporters, connectors, extensions, and service. What matters is that defining a component in the first five is not enough to activate it. It runs only when it is referenced in service.pipelines (and, for extensions, service.extensions). Half of the incidents where you finish writing the configuration and nothing happens come from here.
connectors are components that join the output of one pipeline to the input of another pipeline. A typical example is spanmetrics, which extracts RED metrics from traces. It is both an exporter and a receiver at the same time, so it has its own section.
Let us look at the difference order makes one item at a time.
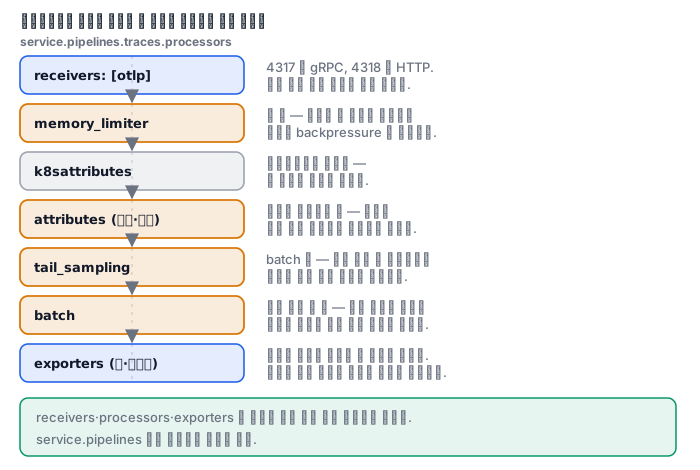
memory_limitergoes first because this processor does not reduce data; when it detects memory pressure it rejects data outright and returns backpressure upstream. If you put it later, it rejects only after memory has already been spent on parsing and conversion, and the protective effect disappears.tail_samplingmust come beforebatch. The sampling decision is per trace, but ifbatchis applied first, the spans of the same trace are scattered across different batches and the unit of decision is no longer whole.batchis almost always last. Batching is a step for transmission efficiency, so if you attach anything after it, you waste effort breaking the batch apart and regrouping it.- For redaction and hashing, you need to think about the order the opposite way. A processor that attaches metadata, such as
k8sattributes, can create new attributes, so the removal must come after it to apply without gaps.
There is a convention for sizing memory_limiter.
| Container memory | limit_mib |
spike_limit_mib |
GOMEMLIMIT |
|---|---|---|---|
| 1Gi | 820 | 164 | 656MiB |
| 2Gi | 1638 | 328 | 1310MiB |
| 4Gi | 3276 | 655 | 2621MiB |
limit_mib is about 80% of the container limit, and spike_limit_mib is 20% of that. If limit_mib is higher than the container limit, the kernel kills the process before the processor can step in.
The common mistake with batch is taking send_batch_size for an upper bound. This value is a trigger meaning "send immediately once this much has accumulated," and the upper bound on the actual batch size is send_batch_max_size. If you do not set the latter, batches can grow much larger than expected.
What it looks like in the field
Symptoms split into three kinds.
No data comes in at all. Temporarily attach a debug exporter and first check whether data reaches the receiver. If the receive metric is 0, either the app has not sent anything yet or it is looking at the wrong address, and the most common cause is having swapped the gRPC and HTTP ports.
It comes in, but it is not in the backend. Look at the send failure metrics first, and if there are no failures but data still vanishes, look at the queue metrics and refusal metrics. Quite often tail_sampling is the cause here. If the policy is more aggressive than intended, the data was sent normally but only certain traces are missing from the backend, and the metrics report nothing wrong. The fastest way to tell is to take it out of the pipeline for a moment and see whether the problem reproduces.
It dies periodically. Most of the time this is memory pressure. If it dies even though memory_limiter is already there, suspect that the limit does not match the container limit.
The self-metrics you need to read fall into three stages. For receiving, the pair otelcol_receiver_accepted_spans and otelcol_receiver_refused_spans; for processing, a comparison of otelcol_processor_incoming_items and outgoing_items; for sending, otelcol_exporter_sent_spans, send_failed_spans, enqueue_failed_spans, and the ratio of queue_size to queue_capacity. If you set only one alert, choose a queue metric. If the queue stays pinned at capacity, what follows is almost always refusal and data loss.
What you will do in the next lab
You write a single /root/otca-collector/config.yaml from start to finish: two OTLP receiver ports, a memory_limiter set at 80% of the container limit, Kubernetes metadata attachment, redaction and hashing of sensitive attributes, a batch with both trigger and upper bound specified, exporters with queues and retries turned on, the health_check and zpages extensions, and three pipelines that respect the processor order.