
Loki — A Log Store That Does Not Index Logs
The Choice Not to Index
In one line
Loki does not index the log body; it indexes only the label set. That makes storage cheap, and in exchange search becomes "narrow down candidates by label, then scan the body."
Why this was needed
Elasticsearch/OpenSearch put every token of a log into an inverted index, so they can instantly find "logs that contain the word error." The price is high — the index often grows larger than the original data, and the indexing work itself uses a lot of CPU and memory.
Loki asked a different question. "When we actually look for logs, what do we do?"
Usually it goes like this. You narrow the scope to "the payment service, in production, over the last 30 minutes" and then look for a string inside it. The narrowing at the front needs only a few labels, and the scanning at the back is fast when that scope is small.
So Loki indexes only labels and stores the body compressed in chunks. Using the same label model as Prometheus is also deliberate — you spot an anomaly in a metric and can move to the logs with the same labels.
How it works
{namespace="labhub-prod", app="labhub"} |= "error" | json | status >= 500
 ^--------- 라벨 셀렉터 (색인됨) -------^  ^--- 본문 필터 (훑음) ---^
The curly braces at the front select the streams. One label combination is one stream. The pipe after them scans the bodies of those streams sequentially.
Performance depends entirely on how much you narrow at the front. If the label selector picks 10 streams it is fast; if it picks 100,000 it is slow.
Cardinality — worse in Loki
It is well known that label cardinality is a problem in Prometheus. In Loki it is worse.
Every label combination creates its own stream and its own chunk files. If you put trace_id or user_id in as a label, you end up with millions of streams, each producing a small chunk file. The storage gets buried in small files, and a query has to open all of them.
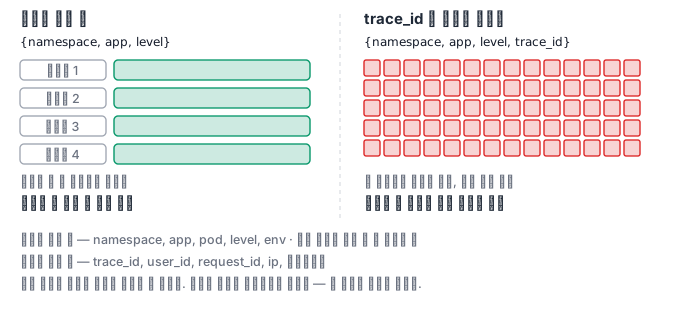
Rule: labels only for things with few distinct values that rarely change.
| Good as labels | Bad as labels |
|---|---|
| namespace, app, pod, level, env | trace_id, user_id, request_id, ip, timestamp |
Leave the bad ones in the body and find them with |= or | json when you need them. That is the design intent of Loki.
Where it diverges from OpenSearch
| Question | Which one |
|---|---|
| "Errors from this Pod in the last 30 minutes" | Loki — labels narrow it down and the range is small |
| "This order number across the last 3 months" | OpenSearch — there is no label to narrow by and the range is large |
| "Top 20 error messages by frequency" | OpenSearch — it needs aggregation |
| "Logs from the moment of an anomaly seen in a metric" | Loki — its labels are the same as Prometheus |
The two are not competitors; they answer different questions. In practice many places run both — Loki for recent data cheaply, OpenSearch for older data that must stay investigable.
Common misconceptions
"Loki is always cheaper" — with badly chosen labels it can end up worse than OpenSearch. A stream explosion is also hard to undo (the old chunks stay where they are).
"grep is enough" — when logs are scattered across several nodes and a Pod dies, they disappear. The reason to collect them is not search but retention.
What to keep and what to discard
Logs are the cheapest of the three signals to produce and the most expensive to store. So unless you decide at collection time to reduce the volume, sooner or later it becomes a problem, either in cost or in search speed.
Discard what you can afford to discard first. The access log written for every normal request is usually replaced by metrics. Metrics answer request rate per second and status code distribution far more cheaply, so it is better for logs to focus on what deviates from the normal flow. Lines printed several times per second, such as health checks and readiness checks, are especially good candidates to filter out first.
If the same line repeats, group it. It is common for a component stuck in a retry loop to pour out hundreds of lines per second, all with identical content. If the application counts repeats of the same message and summarizes them in one line, the volume drops by orders of magnitude.
Split retention into tiers. Keeping everything for 90 days is far more expensive than keeping most of it short and keeping only what needs auditing long. However, which line belongs to which tier must be distinguishable by label, and that ties back to the label design we saw earlier.
And the format of a log is the later cost of searching it. If you keep it in a structured form, parsing finishes in one pass and you can narrow by condition, but if you keep only human-friendly sentences, you have to scan strings every time. Deciding in advance what goes into a line is the answer here too, and the four things we covered when discussing tracing — the request identifier, the deployed version, the processing time, and the name of the target on failure — remain valid in logs as well.
Finally, you should check whether the logs contain personal information at least once. If somewhere there is code that leaves the whole request body in the log, all of those logs become assets of a different class, and the retention period and access permissions must be redecided accordingly.
What really matters in practice
When a Loki query is slow, the first thing to look at is the number of selected streams.
count(count by (pod) ({namespace="labhub-prod"}))
If this value is large, either narrow the label selector further, or the label design was wrong from the start. You have to fix the collection configuration, not tune the query.