
Loki — A Log Store That Does Not Index Logs
The answer that gets cut silently is the dangerous one
In one line
limit cuts the answer silently, and server limits reject the query with a 400. The one that ruins an incident investigation is always the silent one.
Why this was needed
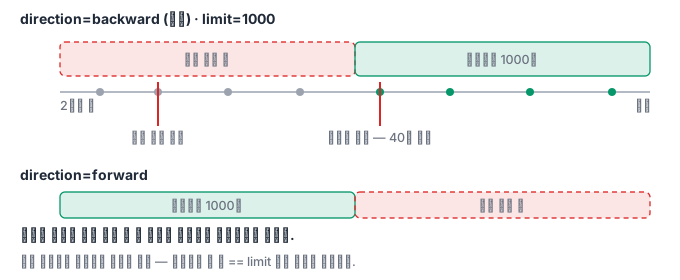
Someone looking for the cause of an incident threw {app="gateway"} |= "timeout" over a two-hour range. The result was 1000 lines, and they reported the time of the earliest line as the start of the incident. Later it turned out the real start was 40 minutes before that.
The default of limit was 1000 and the direction was backward. That is, only the most recent 1000 lines came back, and the lines before them never appeared on screen. There was no "truncated" indication anywhere in the response. The only clue was that the number of lines returned was exactly equal to limit.
How it works
Three things decide the number of results of a log query.
| Lever | Nature | If exceeded |
|---|---|---|
The request's limit |
The client chooses | Silently truncated |
limits_config.max_entries_limit_per_query |
An upper bound set by the server | Rejected with 400 |
limits_config.max_query_length |
An upper bound on range length | Rejected with 400 |
direction decides what gets cut off. backward (the default) fills from the most recent, so the old lines are cut off, and forward is the opposite. If you use the default when looking for the start of an incident, exactly what you want to find is cut off.
A query is also split into time pieces according to split_queries_by_interval and run in parallel. splits in the response statistics is the number of those pieces. With many pieces it finishes sooner, but load concentrates on the scheduler and queriers. Conversely, if the number of pieces is 0, it ran as a single piece.
So the right way when you have to scan a wide range is not to raise limit. It is to cut the range, ask several times, and combine. If each piece's number of results is smaller than limit, it is guaranteed that piece is complete, and the total can be trusted. An automation script should almost always take this shape.
It is rare for raising the limit to be the answer. If you raise max_entries_limit_per_query, the queriers' memory grows, and one person's query can shake the whole cluster. A limit is a safety device that prevents incidents, not an obstacle.
What it looks like in the field
First, always be suspicious when "the number of lines returned == limit." For automation, you should check this condition explicitly and raise a warning. For a dashboard that people use, even just writing the limit in the panel title greatly reduces misunderstanding.
Second, use direction=forward when finding the start time of an investigation. This one word changes the timeline in the report.
Third, the body of a 400 response is usually helpful — it even writes the numbers, which limit you exceeded and by how much. If automation throws that body away and logs only the status code, you will end up re-throwing the same query by hand later while searching for the cause.
What you will do in the next lab
You put in two hours of data and confirm in numbers that limit silently cuts when you give it a small value. You deliberately exceed the server limit and receive the 400 and its body yourself, and confirm the range length limit the same way. You measure how splits varies with the range, and finally you build a script that cuts a range within the limits and counts two hours without missing anything.