
Loki — A Log Store That Does Not Index Logs
Why p50 and p95 come out the same
In one line
LogQL metric queries turn logs into numbers. But labels created by the parser split the series as they are, so unless you tidy up the labels, quantiles and sums quietly become meaningless.
Why this was needed
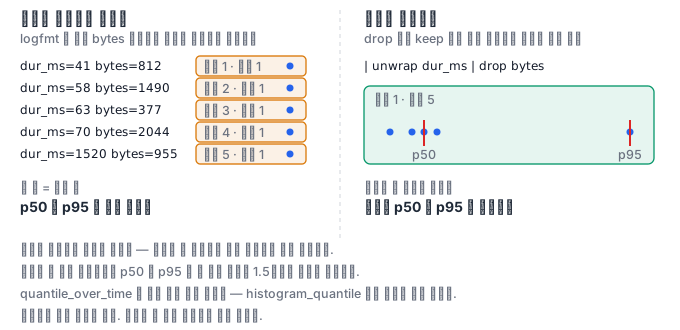
A team wanted to measure p95 with Loki for a service that had not yet instrumented a latency histogram. The logs had dur_ms=... printed in them, so quantile_over_time(0.95, {app="checkout"} | logfmt | unwrap dur_ms [5m]) seemed like it would do. The graph drew nicely and the numbers looked plausible.
The problem was that p50 and p95 came out almost the same. The logs clearly had a 1.5-second tail, yet p95 stayed in the 60-millisecond range. The cause was the bytes=... field printed alongside in the logs. Its value differed on every line, so the bytes label that logfmt created made one series per line. With only one sample per series, whichever quantile you ask for gives that line's value as it is.
How it works
LogQL metric queries come in two kinds.
Log range aggregations count lines. count_over_time, rate, bytes_over_time, and bytes_rate belong here. They need no parser, and if needed a filter selects the lines to count.
Unwrap range aggregations work on a number extracted from the line. You decide which value to use with | unwrap <라벨> (the placeholder is the label name), and then apply avg_over_time, max_over_time, quantile_over_time, sum_over_time, or rate_counter. If the value is a string with a unit attached, you can wrap it in duration_seconds(...) or bytes(...) to convert it.
In both kinds, the identity of a series is decided by labels. That includes not only the stream labels but also every label the parser created in that query. So when you use unwrap, you almost always need to tidy the labels — keep only what you need with | keep <쓸 라벨> (the placeholder is the labels to keep), or strip off fields with scattered values with | drop <버릴 라벨> (the placeholder is the labels to drop). Or wrap the outside in an aggregation such as sum by (...) or max(...) to group the series.
There is one difference from Prometheus here. Prometheus's histogram_quantile estimates quantiles from data already summarized into buckets, but Loki's quantile_over_time scans all the raw values. So it is more accurate but far more expensive. If you apply it to a wide range, the amount read becomes the cost as it is.
Finally, it is better not to forget that building metrics from logs is a stopgap. If you export the same number as a metric, a line shrinks to a few bytes and queries get close to constant time. Log-based metrics are a tool for when there is no instrumentation or when you need to look back at the past.
What it looks like in the field
The most frequent incident is the "series explosion" above. The symptom is peculiar — there is no error and the graph draws, but p50 and p99 travel together. If you suspect it, count the series first. If the series count is close to the line count, you have your answer.
The second is dashboard cost. If you leave one quantile_over_time panel on a 24-hour range and refresh it every 30 seconds, that panel alone rereads a day of logs every 30 seconds. For log-based quantile panels, it is better to keep the range short, and if you need a long range, fold it in advance with a recording rule.
The third is units. If dur=1.5s and dur_ms=1500 come out mixed in the same service, unwrap adds the two as they are. The habit of building the unit into the field name prevents this incident.
What you will do in the next lab
You put the logs of two services into the Pod's Loki and build a query that counts lines and a query that extracts values. You try to get p95 with unwrap and see for yourself the series split into as many pieces as there are lines, count the series, and then tidy the labels and confirm that p50 and p95 separate. Finally, you compare with exporting the same number as a metric and write down which to choose, with your reasons.