
Loki — A Log Store That Does Not Index Logs
Line filters do not reduce how much is read
In one line
The price of a Loki query is set by the bytes read. And only two things reduce the amount read: the stream selector and the time range — line filters and parsers merely screen out lines that have already been read.
Why this was needed
Someone investigating a payment error at dawn threw {cluster="prod"} |= "payment" |= "timeout" over a one-day range in Grafana. The query ran for 4 minutes and was cut off by a timeout. The person next to them changed it to {cluster="prod", app="pay"} and narrowed the range to 30 minutes, and the answer came in 2 seconds. The results of the two queries were the same.
The difference was the amount read. The first query read one day of every stream in that cluster and then filtered, while the second read only 30 minutes of one stream. The two line filters did not reduce the amount read by a single byte.
How it works
Loki does not index the body. All the index holds is the label combination (the stream) and which time periods that stream's chunks cover. So the order in which a query runs is always the same.
- The selector looks at the index and picks which chunks of which streams to open.
- The time range keeps only the chunks among them that overlap.
- It reads all of the remaining chunks and applies line filters, parsers, and label filters in turn.
Only steps 1 and 2 decide the amount read. Step 3 is the work of throwing away what has already been read. So in the statistics that come with the response, totalLinesProcessed and totalBytesProcessed respond only to the selector and the range, and only totalPostFilterLines and the number of returned lines respond to filters. Reading these two pairs separately is close to the whole of how to tune a Loki query.
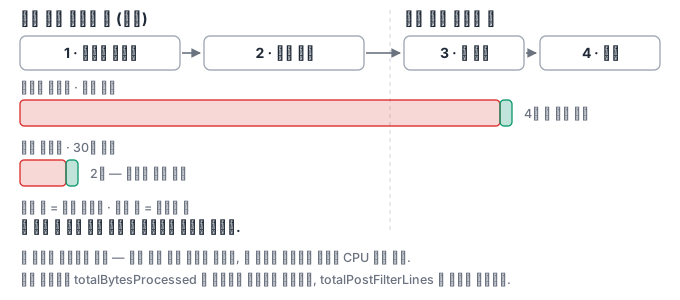
That does not make line filters useless. A line filter is much cheaper than a parser. A parser must interpret the syntax of each line to create labels, and a label filter compares those labels. So when you attach a parser, putting a line filter in front to reduce the number of lines the parser sees is still a gain — but that gain comes from CPU, not bytes read. If you mix the two up, you get stuck at "I put the line filter first, so why isn't it faster?"
limit is not a reliable cost lever. For a simple log query, Loki can collect as much as it needs and stop early, so the amount read sometimes shrinks. But how much it shrinks depends on how many pieces the query is split into and run in parallel, so even if you throw the same query over the same range twice, the number of lines read comes out different (this is what actually happened in this lab environment). So you cannot plan on "let's save cost by lowering limit," and limit does not apply at all to metric queries.
This is why label design ends up being query performance. Without an app label there is no way to narrow at all, and conversely if you put something like user_id in as a label, the streams explode and the index lookup itself becomes expensive. Labels only as far as they let you narrow, the rest in the body — this balance is the center of operating Loki.
What it looks like in the field
Cost incidents usually happen on dashboards. A person throws a few queries by hand a day, but a dashboard panel runs automatically every 30 seconds. A single panel with a loose selector reads tens of terabytes in a month. So when you build a dashboard, take the stats of each panel once, and for panels that read a lot, narrow the selector or shorten the default range.
One more thing. People have a habit of setting a wide range when investigating. It is "I don't know when, so let's say a day for now." But the incident time is usually already known from a metric or an alert. If you change the order so that you first pin down the time from metrics and look at the logs only 15 minutes before and after it, the same investigation gets ten times faster.
What you will do in the next lab
You put 2400 lines across four streams into the Pod's Loki, and throw a query that finds one rare marker line in four different ways. Each time you read the response's stats.summary and record the lines and bytes read, make a table showing that those numbers shrink only when you narrow the selector or narrow the range, and finally write and submit a query that gives the same answer within a fixed budget.