
curl Reports the Segments Separately
In a nutshell
If you use the timing variables of curl -w, a single request can separate where it is slow among name resolution / connection / TLS / server processing. This one line ends the debate of "is it the network's fault or the application's".
Why this was needed
Responses became slow right after a deployment. The infrastructure team says it is an application problem, and the development team says it is a network problem. Both sides see normal on their own dashboards.
What is needed in this situation is not more dashboards but splitting the time of a single request by segment.
curl -sS -o /dev/null -w 'dns:%{time_namelookup} conn:%{time_connect} tls:%{time_appconnect} ttfb:%{time_starttransfer} total:%{time_total}\n' https://api.example.com/health
Each value is cumulative time from the start of the request, so looking at the differences gives the time spent in each segment. The interpretation rules are clear.
| Where it is large | Conclusion |
|---|---|
time_namelookup |
Name resolution problem. Go to the DNS segment |
time_connect - time_namelookup |
TCP connection. Path or firewall |
time_appconnect - time_connect |
TLS handshake. Certificate chain, protocol negotiation |
time_starttransfer - time_appconnect |
The time for the server to produce the first byte. The application |
time_total - time_starttransfer |
Body transfer. Size or bandwidth |
If everything is normal up to time_connect and only time_starttransfer is large, the network is innocent. The debate ends right there.
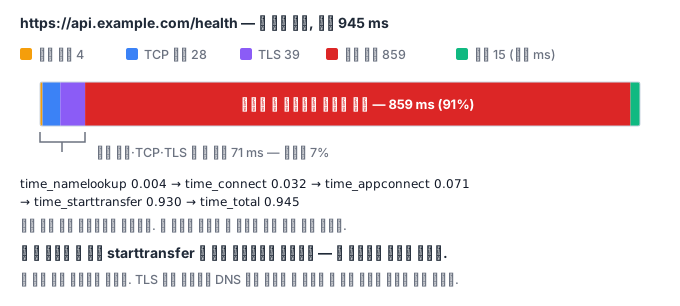
How it works
Extracting only the status code. curl -s -o /dev/null -w '%{http_code}' URL discards the body and prints only the status code. It is the basic form of a health check script. If the connection itself fails, 000 comes out - you must handle this value separately to distinguish "the server returned a 5xx" from "could not reach the server".
Receiving only headers. curl -sI URL sends a HEAD request and receives only the headers. If Content-Length differs from what you expect, a cache or proxy may be in between.
Redirects. By default curl does not follow redirects. You must add -L for it to follow. So it is normal for the same URL to give 301 without -L and 200 with it. If you do not know this in a health check, you spend time on "why is it a 301".
A timeout is not optional. If you run a health check without --max-time, the script stops forever when the other side does not respond. If cron launches such a script every 5 minutes, processes pile up. Always set a maximum wait time on health checks.
What it looks like in the field
Reproducing locally. Even in an environment where the network is blocked, a single python3 -m http.server can reproduce most HTTP behavior. Status codes, headers, redirects, and even the response for unimplemented methods are just as they really are. This is also why the lab uses this approach, and in practice it is often used when validating client code.
Cut JSON responses with jq. If you chain with a pipe, as in curl -s URL | jq -r '.items | length', you can pull values straight out in a script. However, there is a trap in which, when curl fails, jq receives empty input and quietly passes over it, so in scripts you need set -o pipefail.
The contract of a health check script. A good health check reports three things distinctly - healthy (2xx), a response came but it is unhealthy (4xx/5xx), and could not reach at all (connection failure). If you lump the three into one failure, you receive an alarm and still do not know where to start looking.
Pointing at the slow segment with numbers
A report that "the API is slow" does not tell you where to look. The timing variables of curl split one request into five segments. Which segment has ballooned is, in effect, which team's problem it is.
curl -sS -o /dev/null -w \
  'dns=%{time_namelookup} tcp=%{time_connect} tls=%{time_appconnect} \
ttfb=%{time_starttransfer} total=%{time_total}\n' \
  https://example.com/api/health
The numbers are cumulative. If time_connect is 0.32, it means it took 0.32 seconds up to the connection, not that the connection took 0.32 seconds. You get the time actually spent in each stage by subtracting.
| Segment | Calculation | What to suspect when ballooned |
|---|---|---|
| Name lookup | namelookup |
The search domains in resolv.conf, DNS server response |
| TCP connection | connect - namelookup |
Network round-trip time, firewall, accept queue |
| TLS handshake | appconnect - connect |
Certificate chain length, OCSP lookup, failure of session reuse |
| Server processing | starttransfer - appconnect |
The application and the DB |
| Body transfer | total - starttransfer |
Response size, bandwidth, whether compressed |
If only TTFB is large, from then on it is the application's part. If the first three segments are all small and only starttransfer is large, the network is innocent. Conversely, if connect is large but starttransfer is small, you will get no answer however much you stare at the code.
Do not judge from one measurement. Because of TLS session reuse, DNS caches, and connection pools, the first request and the second request are entirely different in nature. Run it at least ten times and look at the median and the tail value together.
for i in $(seq 20); do
  curl -sS -o /dev/null -w '%{time_starttransfer}\n' https://example.com/api/health
done | sort -n | awk '{a[NR]=$1} END {print "중앙값", a[int(NR/2)], "p95", a[int(NR*0.95)]}'
Look at the tail, not the average. It is common for the average response time to be good while users say it is slow. This is because users remember the slowest request they experienced.
What you will do in the next lab
You will start an HTTP server locally and extract status codes, headers, timing, and JSON separately. You will confirm yourself the difference between following and not following redirects and the response for an unimplemented method, and finally build a health check script that reports by distinguishing three situations.