
Apache Flink — Running Streams on a Real Engine
Watermarks — How the Engine Decides "This Window Is Now Closed"
In one line
An event-time window closes only when the watermark passes the end of the window. A watermark in Flink SQL is declared like WATERMARK FOR ts AS ts - INTERVAL '5' SECOND, and its value is "the maximum ts seen so far − the delay". A row that arrives after its window has closed is silently dropped. The delay is the knob that trades accuracy for latency.
Why this was needed
For the GROUP BY user_id of the previous module, it was fine to keep rewriting the result. But a requirement like "add up the sensor values every minute and emit them just once" is different. To emit just once, you have to know that the minute has ended. Deciding by the wall clock (processing time) is simple, but as the official docs (Timely Stream Processing) point out, processing time is shaken by arrival speed, failures, and reprocessing, so it is not deterministic. If you rerun yesterday's data, the result changes.
So windows are split by the event time written in the record. The problem is that events do not arrive in order. A sensor value from 12:00:59 can arrive later than a value from 12:01:10. When should the 12:00 window be closed? You cannot wait forever. The watermark is a promise in answer to this question — Watermark(t) is a declaration that "from now on we consider that no more events with ts ≤ t will come".
How it works
Declaration. According to the docs (CREATE Statements), the WATERMARK clause turns one TIMESTAMP(3) column into an event-time attribute. If you look with DESCRIBE, *ROWTIME* is attached to the type of that column. There are three common strategies.
| Expression | Meaning |
|---|---|
ts |
Strictly ascending — the maximum ts seen is the watermark |
ts - INTERVAL '0.001' SECOND |
Ascending — a row with the same time as the maximum ts is not late |
ts - INTERVAL '5' SECOND |
Input that is out of order — wait up to 5 seconds |
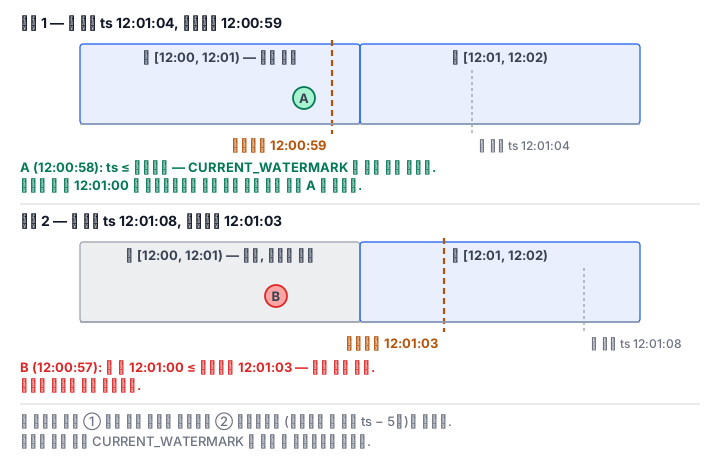
When it goes out. The expression is evaluated for every record, but the docs say the watermark is emitted at the period of pipeline.auto-watermark-interval (default 200 ms). However, if you look at the source of the operator that attaches watermarks, there is one more thing — if the new watermark is ahead of the last emitted value by more than the interval, it is emitted right at that record without waiting for the period. And the order matters. The record is passed downstream first, and then the watermark is advanced. So the watermark a row sees is "the maximum ts up to the rows before it − the delay". With second-granularity timestamps, the advance is always larger than 200 ms, so a watermark goes out for every record, and the result is determined regardless of execution speed. That is why the lab grader can reproduce the result from the arrival order alone.
The condition for a window to close. A window aggregation emits the result of that window once the moment window_end ≤ 워터마크 (the window end is at or below the watermark) is reached, and clears its state. If a row that would belong in that window arrives after that, there is no place to receive it, so it is dropped. No error, no warning. When a file with an end has been read to the end, the engine sends the maximum watermark and closes all the remaining windows.
A late row and a closed window are different things. CURRENT_WATERMARK(ts) returns the current watermark of the operator the row passes through (Built-in Functions in the docs; NULL if there is none yet). A row with ts <= CURRENT_WATERMARK(ts) is a late row by the watermark criterion. But its window may still be open — even if a row from 12:00:58 comes after the watermark 12:00:59, the end of the 12:00 window (12:01:00) is still to the right of the watermark. So if you filter in front of the window with the docs' filtering expression (CURRENT_WATERMARK(ts) IS NULL OR ts > CURRENT_WATERMARK(ts)), you drop more rows than if you left it to the window. Measured with the lab data, at a 5-second delay the window drops 15 rows, while 98 rows are late by the watermark criterion.
When parallel. The event time of an operator that receives several inputs is the minimum of the watermarks of its inputs (Watermarks in Parallel Streams in the docs). If even one partition goes quiet, the overall watermark stops. To resolve that, there is a setting, table.exec.source.idle-timeout, that temporarily removes a quiet source. This lab has parallelism 1, so you will not see this effect.
What it looks like in the field
Many reports of "the aggregate number is a bit lower than the source" are late rows. Dropped rows leave no trace in the logs either, so the first diagnosis is to run the same data once in batch and measure the difference. If you increase the delay and the difference shrinks, the cause is settled. Increasing the delay makes the window results come out that much later — whether it is fine for the dashboard to be 5 seconds late or up to 30 seconds is for the business to decide.
The second is "no result comes out at all". If the watermark does not advance, the window never closes. It is the case where one partition is empty, the source's ts is NULL, or the times in the test data are clustered at a single point. Setting the watermark interval very large causes something similar — in the lab, if you set the interval to 1 hour, the advance stops after the first watermark, and since it is a file with an end, everything is closed at once at the end, and you get a result with not a single dropped row. With an infinite stream, the windows would not have closed for an hour.
The third is the request to collect late rows separately instead of dropping them. In SQL, a common approach is to mark late rows with CURRENT_WATERMARK and send them to another sink. But as seen above, "rows earlier than the watermark" and "rows that will be dropped because their window has already closed" are different sets. You have to decide first which one to collect.
What you will do in the next lab
You declare 600 sensor events (file order is arrival order) with a 5-second delay watermark and check with DESCRIBE. You run a 1-minute TUMBLE aggregation in batch to build a baseline, compare it with the streaming results at delays of 5, 0, and 30 seconds, and count the dropped rows. You pull out the late rows with CURRENT_WATERMARK, see how the result differs when those rows are filtered in front of the window, change the watermark interval to 1 hour to see what changes when the advance stops, and then write up the numbers as a report.