
Apache Flink — Running Streams on a Real Engine
Where state lives and how much — operators, TTL and backends
In one line
State lives not in the job as a whole but in each operator separately. Which operator holds what and what its TTL is, COMPILE PLAN writes out exactly as JSON. An unbounded GROUP BY and a regular join hold forever by default, while a window aggregation clears itself when the window closes. The state backend decides only where and in what shape to put that state, and does not change results.
Why this was needed
If you run a streaming job for a few weeks, almost without fail you get the question "why do memory (or disk) keep growing?". The official docs warn about GROUP BY like this. The state needed to compute the result of a streaming query can grow without bound, and its size depends on the number of groups and the kind of aggregate function (MIN and MAX are heavy and COUNT is light). The previous module said a regular join holds both inputs forever.
So you set a TTL (idle state retention time). But a TTL is not free. The determinism chapter of the docs (Determinism) says that clearing state with a TTL is often a necessary compromise but can make the results non-deterministic. If a row arrives late for a key that has been cleared, it is counted again like a key seen for the first time. So you have to know and decide "how much to set on which operator" at the operator level. This module is about how to read that map from the execution plan.
How it works
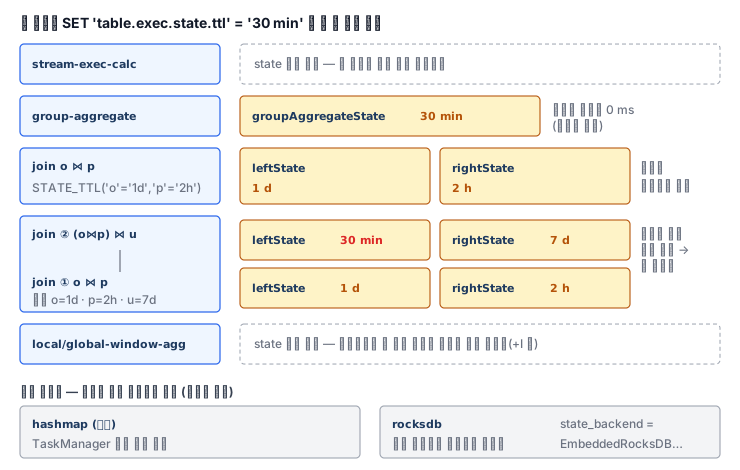
COMPILE PLAN 'file:///경로.json' FOR INSERT INTO ... writes the optimized plan as JSON without running the job (where the placeholder stands for the path). Each node has a type, and nodes that have state get a state list. The results extracted in this lab environment are as follows.
| Node (type) | state entries | Default TTL |
|---|---|---|
| stream-exec-calc (filter and project) | None | — |
| stream-exec-group-aggregate (unbounded GROUP BY) | groupAggregateState | 0 ms |
| stream-exec-join (regular join) | leftState · rightState | 0 ms |
| stream-exec-deduplicate · stream-exec-rank | deduplicateState · rankState | 0 ms |
| Interval join · temporal join · window aggregation | None | — |
0 ms means "never erase". The explanation of the setting in the docs (table.exec.state.ttl) says exactly that — it keeps state that has not been updated for at least this long, and if it stays idle longer than that, it is erased sometime afterward. The default value 0 means to leave it forever. If you give SET 'table.exec.state.ttl' = '30 min', all the 0 ms in the table above change to 30 min. The operators in the last row of the table clean up state not by TTL but by time (the watermark passing the end of a window or an interval), so there is no TTL entry in the plan. The docs also say "a short-lived window GROUP BY is not a problem".
Setting one value for the whole job is coarse. There are joins where orders must be remembered for a day but payments need only two hours. That is why there is the STATE_TTL hint. It is used only on regular joins and GROUP BY, and you give a table name or an alias as the key (if you attached an alias, it must be the alias).
SET 'table.exec.state.ttl' = '30 min';
SELECT /*+ STATE_TTL('o' = '1d', 'p' = '2h') */ ...
FROM orders o JOIN payments p ON o.order_id = p.order_id;
-- 계획: leftState "1 d" · rightState "2 h"  (잡 기본값보다 힌트가 우선)
When joins are chained, there is one more rule. The docs say the three hints are resolved for the left and right of the first join and the right of the second join, and the left of the second join (the result of the first join) comes from the job settings. In fact, when I gave STATE_TTL('o'='1d','p'='2h','u'='7d') with a job default of 30 min and extracted the plan, the second join had leftState "30 min" and rightState "7 d". To decide that slot as well, you have to split the first join off as a view and give it a separate hint.
The state backend is where these states are put. According to the docs, if you decide nothing, it is a HashMapStateBackend, which keeps state as objects on the Java heap. EmbeddedRocksDBStateBackend keeps it as serialized bytes in RocksDB on the TaskManager's local disk. It can hold as much as the disk allows, but in exchange you pay a serialization cost on every read and write. The docs point to this one as the backend that provides incremental checkpoints, and say the ForSt backend, which keeps state in remote storage, is still experimental. You can change it per job with SET 'state.backend.type' = 'rocksdb', and which backend it ran with is left in the state_backend field of the /jobs/<jid>/checkpoints/config response. Even if you run the same GROUP BY on RocksDB, the result does not differ by a single character.
What it looks like in the field
When an alert comes that state is growing, first extract the plan. You can see at a glance which operator holds what with a TTL of 0 ms. The culprit is often an unbounded GROUP BY written without thinking, or a regular join with a dimension table. Whether you can change it into a window aggregation or a temporal join is the fix to look at before TTL.
If you decide to set a TTL, think of hints before a job-wide value. A job-wide 30 minutes erases even day-long order state in 30 minutes and makes the results wrong. Conversely, if you trust only hints and forget the second-left slot of a chained join, that slot receives the job default (default 0 = forever). The habit of confirming with the numbers in the plan JSON is the answer.
The reason for changing the backend is usually that the heap is short. The TaskManager task heap of this Pod is a little over 200 MiB, so large state does not fit in hashmap. If you move to RocksDB, you can let it spill over to disk, but it gets slower — it is a decision that trades size against speed.
What you will do in the next lab
You define three sources and a discarding sink, and confirm from the plan of a query that only filters that there is no state. You read the default TTL of an unbounded GROUP BY, set a job-wide TTL, and see the changed values. You give different TTLs to the two sides of a join with hints, and find the slot a hint does not reach in a chained join. You check the plan and result of a window aggregation, run the same aggregation with the RocksDB backend, and write up all the numbers as a report.