
Apache Flink — Running Streams on a Real Engine
Dynamic Tables and Changelogs — a Streaming Result Is a Table That Keeps Being Rewritten
In one line
In Flink SQL, a stream is a table that keeps getting rows added (a dynamic table), and the result of a query on it is also a table. Every time the result table changes, the engine emits a changelog (+I insert · -U retract the old value · +U new value · -D delete). Which kind of change an operator emits decides which sinks it can write to.
Why this was needed
Batch SQL runs once after all the input has been gathered and then ends. Once the result is written, that is that. A stream has no "after everything is gathered". If you put a query that counts clicks per user onto a stream, it answers u04 → 1 when the first click arrives, and when the second click arrives it has to correct that answer. How do you correct an answer you have already sent out — this is the central problem of streaming SQL.
The answer Flink chose is to borrow the materialized view of databases. The official docs (Dynamic Tables) sum it up this way. A database table is built from a stream of INSERT, UPDATE, and DELETE (a changelog stream), and a materialized view receives that stream and keeps rewriting its result. If you see a stream as a table and a continuous query as view maintenance, you can carry the meaning of SQL over to streams as it is. And the docs make one promise — the result of a continuous query at any moment has the same meaning as the result of running the same query as a batch on the snapshot of the input at that point. The lab of this module starts by checking that promise yourself.
How it works
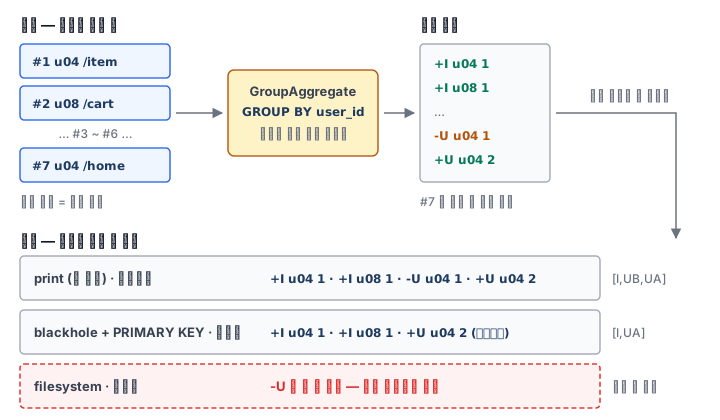
Stream → table. Each record of the source is interpreted as an INSERT into the result table. Clicks read from a file or a log form an append-only table.
Table → table. A query fixes the result table every time its input table changes. A filter (WHERE dwell > 60) or a projection turns one input row into one result row and is done, so the result is also append-only. By contrast, the COUNT(*) of GROUP BY user_id has to change an already emitted result row every time a row with the same key arrives. The docs call the former an append query and the latter an update query, and say that an update query has to hold more state to correct results it has already emitted.
Table → stream. When you send the changes of the result table outside, you have to choose an encoding. These are the three the docs give.
| Encoding | What it sends | What the receiving side needs |
|---|---|---|
| append-only | Only added rows | Nothing — possible only when the result is append-only |
| retract | INSERT is an add, DELETE is a retraction, and UPDATE is two messages: retract (the old row) + add (the new row) | Nothing — it takes the old row's value and deletes it as it is |
| upsert | INSERT and UPDATE are one upsert message, and DELETE is a delete | A unique key — it finds by key and overwrites |
The op column you see in the tableau-mode output of sql-client is exactly this kind of change. +I is an insert, -U is the retraction of the value before an update, +U is the value after the update, and -D is a delete. For a per-user COUNT, a new user emits one +I line and an existing user emits two lines, -U and +U. If the input is append-only and the parallelism is 1, the order and number of this log are completely determined by the input order — that is the basis on which the lab grader reproduces the log line by line in Python and compares.
If you stack an aggregation on top of an aggregation, deletes also arise. If you count "how many users have n clicks", when one user moves from bucket 1 to bucket 2, the -U of the inner aggregation reduces the outer bucket 1 by one. When that bucket reaches 0, the result row itself has to disappear, so a -D comes out.
Which changes each operator emits is printed in the plan by EXPLAIN CHANGELOG_MODE.
GroupAggregate(groupBy=[user_id], ..., changelogMode=[I,UB,UA])   ← 갱신 전·후를 다 낸다
GroupAggregate(groupBy=[user_id], ..., changelogMode=[I,UA])      ← 같은 집계, 업서트 싱크 앞
Calc(select=[user_id, url], where=[>(dwell, 60)], changelogMode=[I])
The reason the same aggregation has two modes is that the optimizer decides what the sink can receive by working backwards. A print sink without a key needs retractions to delete the old row, so it requires UB, and a sink with a declared PRIMARY KEY can just overwrite by key, so UB is left out. The number of messages drops to almost half. Conversely, if you put an update query into a sink that cannot fix a line once written, such as a filesystem sink, it is rejected with "doesn't support consuming update changes" before the job even starts. If you still want to keep the log in a file, you can use TO_CHANGELOG to pull the change kind out into a column and turn every row into an insert (Changelog Conversion in the docs).
What it looks like in the field
The most common accident is a dashboard number that is inflated to double. It happens because the receiving side of a retract stream ignored -U and only added +U, or because the log was attached as it is to a store that only appends. If you count rows without looking at op, an update becomes a duplicate. First check the definition of the result table (what the key is) together with the sink's write method (overwrite or append).
The second is the report "the streaming result differs from batch". When you compare the final state, it is usually the same. What differs is who received the intermediate log and how. But the guarantee that the results are the same is about the case where the input is the same. If a query that drops rows depending on time (the watermark of the next module) or a setting that clears state by time gets involved, it can differ from batch.
The third is when the key of the upsert sink does not match the key of the result table. If the aggregation key is user_id but you set the sink's PRIMARY KEY to another column, the changes the sink receives can get shuffled out of order by the sink key. The docs (table.exec.sink.upsert-materialize in Configuration) say that when such shuffling can occur, the optimizer inserts an upsert materialize operator in front of the sink — an operator that holds the rows it received per key as state and emits them again in the correct upsert order. It amounts to one more piece of state, so the principle is to set the sink key to be the same as the unique key of the result table from the start.
What you will do in the next lab
You run a query that counts 120 clicks per user in both batch and streaming, and confirm that the final states are the same and that the streaming log has 229 lines. You see the -D that comes out of an aggregation over an aggregation, and compare the change kinds of an aggregation and a filter with EXPLAIN CHANGELOG_MODE. After the aggregation is rejected when put into a file sink, you change it to TO_CHANGELOG and write it to the file, and see how the plan differs in front of a sink without a key and a sink with a key. Finally, you write in the report how many messages there would have been if the same log had been sent as an upsert.