
Apache Flink — Running Streams on a Real Engine
One Cluster — the JobManager Decides, the TaskManagers Run
In one line
A Flink cluster is one process that decides (the JobManager) and several processes that run (TaskManagers). One line of SQL becomes a job graph, and the JobManager loads it onto the slots of the TaskManagers. What ran where and why it died is all recorded in the REST API.
Why this was needed
When you first take on stream processing, you usually start from "write SQL and results come out". But the questions you get in operations are not about SQL. "Why did the job stop?", "I raised the parallelism, so why is nothing different?", "I gave the TaskManager 4 GB of memory, so why is the heap only 1 GB?", "Why didn't it restart?". All of these are questions about the structure of the engine.
With a batch script, if it dies you just run it again. A streaming job stays up for weeks and holds state in the meantime. So you have to know "which process is responsible for what" to decide where to look during an outage. This module lays out that map first.
How it works
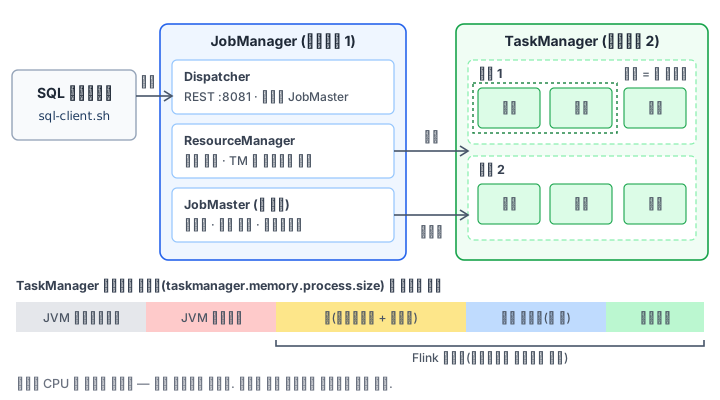
The JobManager is made of three parts (Flink Architecture in the official docs).
| Part | What it does |
|---|---|
| Dispatcher | Opens the REST interface (default 8081) and the web UI, and creates one JobMaster when a job comes in |
| ResourceManager | Manages slots. In a standalone deployment it only divides the slots of the TaskManagers that exist and cannot start new TaskManagers |
| JobMaster | Takes charge of the execution of one job. One is created per job |
A TaskManager actually runs the computation and exchanges data. The smallest unit of resource allocation is the task slot, and the number of slots is the number of tasks that can run at the same time. There are two things to note. First, slots do not divide the CPU — in the wording of the docs, slots today separate only managed memory. Second, several operators can be tied into a chain and run in one thread. That is why source → filter → transform becomes one task. Handoffs and buffering between threads disappear and throughput goes up.
Parallelism is how many copies of an operator you replicate and run. An aggregation with parallelism 2 is split into two subtasks, each occupying one slot. This is where batch and streaming part ways. The default scheduler for batch jobs is the adaptive batch scheduler, so it resets the parallelism of operators you did not specify based on the size of the incoming data. The criterion is an average of 16 MB per task (execution.batch.adaptive.auto-parallelism.avg-data-volume-per-task). If you give parallelism.default = 2 for a small file and the parallelism comes out as 1, it is not a bug but this design. The switch that turns off the automatic decision is execution.batch.adaptive.auto-parallelism.enabled.
Memory is the part of this module most often misunderstood. taskmanager.memory.process.size is the size of the whole JVM process. Within it, the JVM metaspace and JVM overhead are set aside first, and the remaining Flink memory is divided again into framework heap, task heap, managed memory, and network memory.
프로세스 전체 = Flink 메모리 + JVM 메타스페이스 + JVM 오버헤드
Flink 메모리 = 프레임워크 힙 + 태스크 힙 + 프레임워크 오프힙 + 태스크 오프힙 + 관리 메모리 + 네트워크 메모리
This Pod has a 2Gi limit, so the TaskManager is set to 1024 MiB. Then the task heap is barely over 200 MiB. The report "I gave it memory and it still OOMs" usually comes from reading this table backwards. The actual values appear in bytes in the memoryConfiguration of the /taskmanagers response.
Failure and restart. When a job dies, the JobMaster looks at the restart strategy. According to the docs (Task Failure Recovery), if checkpointing is not enabled, the default is no restart, and if it is enabled, the default is exponential-delay. That is why at the top of the exception history of a job without checkpoints you see not the cause but Recovery is suppressed by NoRestartBackoffTimeStrategy. The real cause is at the end of the Caused by: chain below it.
curl -s localhost:8081/overview                  # TaskManager 수 · 슬롯 수 · 버전
curl -s localhost:8081/jobs/overview             # 잡 목록과 상태(FINISHED · FAILED · RUNNING)
curl -s localhost:8081/jobs/<jid>                # 정점(vertex)별 병렬도
curl -s localhost:8081/jobs/<jid>/exceptions     # 실패 기록(exceptionHistory)
What it looks like in the field
The most common scene is "I raised the parallelism but it did not get faster". The cause is usually one of three. There are not enough slots and the job is waiting for resources, or it is a batch job and the adaptive scheduler cut the parallelism based on data size, or the splits of the source (number of files, number of partitions) are fewer than the parallelism so some subtasks sit idle. All three can be told apart by looking at the per-vertex parallelism and the number of subtasks in /jobs/<jid>. If you only look at the throughput graph on a dashboard, the three look identical.
The second is when you changed a setting and it was not applied. Values that the process reads when it starts, such as numberOfTaskSlots or memory sizes, do nothing if you only edit the file. You have to start the TaskManager again. Conversely, values read at job submission, such as SET 'parallelism.default', take effect right away from the next job. If you do not know which kind it is, all that piles up is anecdotes like "it worked after I restarted".
The third is the incident report. The alert arrives as a single line, "job FAILED". If you paste the top sentence of the exception history as it is, everyone mistakes the restart strategy for the cause. The habit of finding and writing down the Caused by at the end of the chain decides the quality of the report.
What you will do in the next lab
You start the cluster, check the TaskManager and slots through REST, and convert the memory budget into numbers. You run a job that aggregates an orders file in batch mode, find it in the job list, run the same job again with parallelism 2, and check the vertex parallelism. After changing the slots to 4 and starting again, you deliberately create a job that dies while converting a string to an integer, and write up the real cause and the restart strategy in a report.