
The Order in Which You Read Envoy Configuration
In one line
Receive on a listener, pass it through a filter chain, and send it to an endpoint of the cluster that a route picks. All of Envoy configuration is a combination of these five words.
Why this was needed
Envoy configuration JSON is overwhelming at first sight. But the structure is simple. The incoming side and the outgoing side come in pairs.
| Concept | Counterpart | What it does |
|---|---|---|
| Listener | nginx's server { listen } |
Which address and port to receive on |
| Filter chain | nginx's location + modules |
How to process what was received |
| Route | nginx's location matching |
Picks which backend to send to |
| Cluster | nginx's upstream |
A group of backends (including policy) |
| Endpoint | one server line in an upstream |
The actual address:port |
How it works
The path one request takes looks like this.
클라이언트
  → Listener (0.0.0.0:15001)
    → Filter chain (TLS 종료 → HTTP 커넥션 매니저)
      → Route (Host: shop.example.com, path /api/* )
        → Cluster (outbound|8080||shop.default.svc.cluster.local)
          → Endpoint (10.244.1.7:8080)   ← 로드밸런싱으로 하나 고름
The key point is that the cluster and the endpoints are separate. A cluster holds policy (load-balancing algorithm, connection pool size, outlier detection, circuit breaker), and the endpoints are the actual list of addresses at that moment. Even when Pods start and die, the cluster definition stays the same and only the endpoint list changes.
xDS — the channel configuration flows through
Envoy does not re-read a configuration file and restart. The control plane pushes it in over a gRPC stream. Each kind has a name.
| Abbreviation | What it sends |
|---|---|
| LDS | Listener |
| RDS | Route |
| CDS | Cluster |
| EDS | Endpoint |
| SDS | Certificates (Secret) |
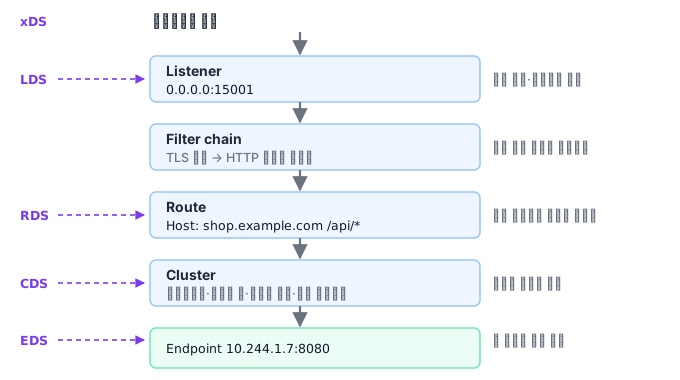
This is exactly what Istio's istiod does. The VirtualService you write is translated into RDS, the DestinationRule into CDS, and the Pod list of a Service into EDS, and they are pushed to each sidecar.
So the way to investigate "I changed the Istio configuration but it is not taking effect" is settled too — look at the configuration the sidecar actually received.
istioctl proxy-config route <pod>       # RDS 로 받은 것
istioctl proxy-config cluster <pod>     # CDS
istioctl proxy-config endpoint <pod>    # EDS
Re-reading the VirtualService is useless. What we wrote and what the proxy received can differ, and that difference is the cause.
The window you actually open when you cannot read the configuration
Envoy's configuration dump runs to tens of thousands of lines. If you try to read it whole you get nothing, so decide on a question and pull out only that piece.
curl -s localhost:15000/config_dump | jq '.configs[].dynamic_listeners[]?.name'
curl -s localhost:15000/clusters | grep -E "myapi|health"
curl -s localhost:15000/stats | grep -E "upstream_rq_(5xx|pending|timeout)"
curl -s localhost:15000/server_info | jq '.state'
Statistics answer where a request went first. Where to look depends on whether upstream_rq_5xx has grown, whether there is any upstream_cx_connect_fail, and whether pending is piling up. Reading the configuration comes after that.
A 503 has several causes, and the response flags tell them apart. If you put %RESPONSE_FLAGS% in the access log, it comes out as a one-letter code.
| Flag | Meaning |
|---|---|
UH |
The cluster has no healthy target at all |
UF |
Could not connect to the upstream |
UO |
The circuit breaker opened and blocked it |
NR |
There is no matching route |
URX |
Hit the retry limit |
This one letter separates "the configuration is wrong" from "the target is dead". If the access log has no response flags, you keep guessing over a single 503 in that cluster.
The default circuit breaker values are usually too low. max_pending_requests is 1024, and if concurrent requests exceed that, Envoy blocks them even though the upstream is fine. If you see the UO flag, this is the place.
If the configuration seems not to change, look at xDS. If *.update_rejected in /stats is growing, Envoy has rejected the configuration the control plane sent. At that point Envoy keeps the last configuration that succeeded, as it is, so on the surface nothing seems to be happening. Setting an alert on this metric pays off a lot.
Common misconceptions
"The sidecar makes requests slow" — Envoy's own latency is usually under a millisecond. Most of the delay you feel comes from connection pool settings, the mTLS handshake, and retry settings. Retries in particular multiply the load several times during an outage.
Why cluster names look random. outbound|8080||shop.default.svc.cluster.local follows a rule — 방향|포트|서브셋|호스트 (direction, port, subset, host). If the subset is empty, it means the DestinationRule's subset is not used. Once you know this rule, you can find the line you want in the configuration dump right away.
What really matters in practice
Envoy statistic names follow a rule too, and that is the map for investigating an outage.
cluster.<클러스터이름>.upstream_rq_5xx          백엔드가 낸 5xx
cluster.<클러스터이름>.upstream_rq_pending_overflow   커넥션 풀이 넘쳤다
cluster.<클러스터이름>.outlier_detection.ejections_active  쫓겨난 엔드포인트 수
listener.<주소>.downstream_cx_total             들어온 연결 수
If upstream_rq_pending_overflow keeps rising, the application is not slow; the connection pool is small. The two call for opposite responses.