
A Watermark Is a Promise, Not a Fact
One-line summary
A watermark is not an observation but a promise that "everything up to this time has arrived," and if you do not decide in advance what to do when you meet data that breaks that promise, you can no longer explain the numbers you published yesterday.
Why this was needed
We already dealt with the watermark once in the earlier lab of this course. It was writing the maximum timestamp of the loaded data in a table and having the next run read only what comes after. The question that watermark answers is one — how far have I read.
But there are things that question alone cannot solve. A mobile app loses signal in the subway and sends events a few minutes later, and a device that was in airplane mode sends events a few hours later. The time of occurrence of those events is a time that has already passed. A time-based watermark never sees that data. And we have already published the aggregate for that time range.
So in the morning meeting this comes up. "The number I saw on the dashboard yesterday is different from today's." If you cannot answer this question, nobody trusts that dashboard from that day on.
How it works
First you must separate the fact that there are three kinds of time. Event time is when it actually happened, ingestion time is when it entered our system, and processing time is when we computed it. The basis of analysis is always event time. If you take processing time as the basis, the answer changes every time you reprocess.
If you divide windows by event time, one problem arises immediately. When do you close this window? If you leave it open forever, no result comes out, and if you close it too early, you miss data that has not yet arrived.
The watermark takes over that judgment. The Flink documentation describes the watermark as "what tells the system the progress in event time." The common formula is this.
워터마크 = 지금까지 본 최대 이벤트 시간 − 허용 지연
창이 닫힌다 = 워터마크가 그 창의 끝을 지났다
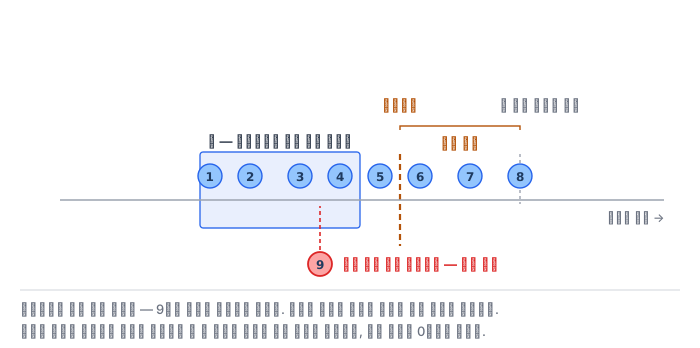
There are two things that are easy to miss here.
First, the watermark does not go backward. The maximum event time increases monotonically, so the watermark also increases monotonically. A late-arriving event does not turn the watermark back. If you make it able to go back, a window that was already closed repeatedly reopens and closes, and no value is ever finalized.
Second, lateness is not a property of the data but a property of the arrival order. Even for the same event, depending on when it arrives, it may or may not be late. So the judgment is made with the watermark computed from the events that arrived before that event. There is an incident that commonly happens here — sorting once by event time to make the data convenient to handle. The moment you do, the arrival order disappears, and late data comes out as 0 rows. When measured, even in data that had more than twenty out-of-order arrivals, exactly 0 comes out. It is not that there is no problem; you have removed the eyes that could see it.
The allowed lateness is the knob that trades accuracy for latency. If you set it large, you accept more late data but the window closes that much later, and if you set it small, you publish quickly but miss more. This value is not decided by gut feeling but read from the actual lag distribution. If you measure the median, the 95th percentile, and the maximum of the lag, it usually bends near the 95th percentile and above that the tail stretches long. If you match it to the maximum, everyone waits because of that one row.
What to do with late-arriving data
There are two options for data that arrives past the watermark.
Drop it. Finalized numbers never change. In exchange, that much quietly disappears, so you must count the dropped rows and amounts separately. If you drop without counting, later there is no basis to explain "why don't our totals match."
Apply it as a late update. The window explanation in the same Flink documentation states that, after you set an allowed lateness, an element that arrives late can fire the window again, and the value that comes out then must be treated as an updated result of the earlier computation. If downstream cannot accept it as an update and only appends, duplicates arise. So this choice is not solely our side's decision.
Either way, the key is to leave the value at the moment of closing and the corrections afterward separately. If you merge them into one, you cannot answer "yesterday's number changed today," but if you leave them separately, the amount that changed is itself the answer.
What it looks like in the field
First, the window does not close. If the data stops, the maximum event time stops, the watermark stops too, and the window stays open forever. This is the idleness problem that the same Flink documentation covers. One quiet partition holds up everything.
Second, you increase the allowed lateness and forget it. When an incident happens, it gets increased to "generous for now," and stays that way. A dashboard that comes out six hours later is not real time. Write the increased value down together with the date by which you will revert it.
Third, reprocessing and late data get mixed. Rerunning a past interval and applying late-arriving data both look like "old numbers change." Because the causes differ, you must leave records separately too.
Fourth, late data concentrates on one side. If you split by region or device model, only a particular group is very late. If you look only at the overall average, that group's data is always dropped, and nobody knows it.
What really matters in practice
- Measure lag as a distribution. Do not decide the allowed lateness from a single average.
- The watermark increases monotonically. Do not let late data turn the watermark back.
- Do not lose the arrival order. If you sort again by event time, late data comes out as 0 rows.
- If you drop, you count. Without the dropped count and amount, you cannot explain.
- Leave the value at closing and the corrections separately. That difference is itself the answer.
What to do in the next lab
You create order events that have passed through the subway and airplane mode, and build up the tool wm.py step by step. You measure the lag as a distribution, move the watermark in arrival order, divide windows by event time, and separate the data that came after a window closed. Then you aggregate the same data with a drop policy and with an apply policy and see how much each window differs, and produce the value at closing and the corrections separately. Finally, you write a report with those numbers. The grader actually runs your tool each time with a different window size and allowed lateness and compares the answers.