
CKAD — Kubernetes Application Developer
Ready and Actually Working Are Different Claims
In one line
A probe is an interface that translates the state of an application into a language Kubernetes can understand. Liveness means "it is dead, so bring it back up," readiness means "do not send traffic right now," and startup means "it is still starting, so wait," and the results of the three lead to completely different actions.
Why this was needed
A container process being alive and a service being healthy are different things. If a JVM falls into a deadlock, the process still exists and its PID is unchanged. An app that is filling its cache has a live process and an open port, but every request it handles ends in an error. Kubernetes cannot look inside a container, so it needed a channel through which the application could report its own state.
But "state" is not one kind of thing. States that get better with a restart (deadlock, connection pool exhaustion) and states that get better with waiting (cache warm-up, a temporary failure of a dependency) call for opposite responses. If you apply a restart to the latter, it is never ready. That is why probes split into two.
The reason a third was added later is also clear. A legacy app can take 5 minutes to start, but if you set liveness initialDelaySeconds to 300 seconds, failure detection is delayed by 5 minutes even during normal operation. The startup probe separates the two — loose while starting, tight after it is up.
How it works
| Probe | If it fails | Until it succeeds |
|---|---|---|
livenessProbe |
Restarts the container | Keeps checking |
readinessProbe |
Removes it from the Service endpoints (no restart) | Receives no traffic |
startupProbe |
Restarts the container | Liveness/readiness do not start at all |
The checking methods are the same for all three. httpGet (success on 200–399), tcpSocket (success if the connection is made), and exec (success if the exit code is 0). There is also grpc, for gRPC health checks.
You have to calculate the timing fields before setting them.
initialDelaySeconds— wait from container start to the first check (default 0)periodSeconds— check interval (default 10)timeoutSeconds— time limit for one check (default 1)failureThreshold— how many consecutive failures before action is taken (default 3)successThreshold— how many consecutive successes count as recovery (fixed at 1 for liveness/startup)
The worst-case delay until detection ≈ initialDelaySeconds + periodSeconds × failureThreshold. If restarts happen too often, raise failureThreshold; if failure detection is slow, reduce periodSeconds. The startup probe's budget is periodSeconds × failureThreshold, and this value must be larger than the app's maximum startup time.
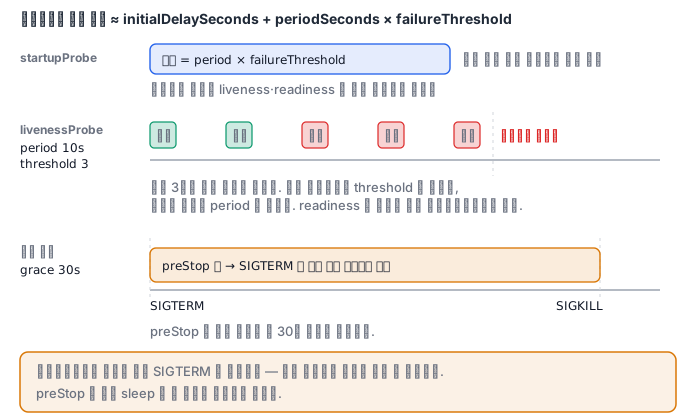
Termination is designed symmetrically. When you delete a Pod, the kubelet sends SIGTERM, waits for terminationGracePeriodSeconds (default 30), and then sends SIGKILL. The Pod is removed from the endpoints at the same time, but the two things are asynchronous, so requests that were already routed may still arrive for a moment. That is why the pattern of putting a short sleep in the preStop hook to wait for endpoint propagation is used. Do not forget that the time preStop runs is also consumed from within the grace period.
Why a container died is left in terminationMessagePath (default /dev/termination-log), and if you set terminationMessagePolicy: FallbackToLogsOnError, then when that file is empty, the last part of the container log is filled in instead. This is the value you see in Last State of kubectl describe pod.
A PodDisruptionBudget applies only to voluntary disruptions (node drain, upgrades). It cannot prevent involuntary disruptions, such as a node suddenly dying. If you apply minAvailable: 2 to 3 replicas, a drain proceeds only one at a time.
What it looks like in the field
I confirmed this lesson three times on my homelab cluster. When I installed KubeVirt, every component was AllComponentsReady, yet the VM would not start. When I took apart the virt-launcher Pod, the volume mount holding the binary the init container was supposed to run was missing. The status field saying Ready and the feature working are different claims. That is why, even after installing the GPU Operator, I did not stop at "all 32 Pods Running" but checked whether nvidia-smi actually sees the GPU inside a Pod. The result was NVIDIA GeForce RTX 5090, 32607 MiB, 570.195.03 — verification is finished only when you see that far.
The same principle applies to logs. What you actually need in the middle of an outage is not reading but filtering and aggregation. So keep the message string constant and move every varying value out into fields.
// 나쁨 — 같은 사건을 세려면 정규식이 필요하다
logger.info(`user ${userId} checkout failed after ${ms}ms`)

// 좋음 — 메시지는 상수, 값은 필드
logger.error({ event: 'checkout.failed', user_id: userId, duration_ms: ms }, 'checkout failed')
Fixing a single criterion for levels also ends the arguments. ERROR means our system failed to fulfill its own responsibility. 4xx responses (bad requests, expired tokens, no permission) are the result of the system working normally, so they are not ERROR. The moment you log these as ERROR, most of the ERROR logs fill up with normal traffic and the real defects get buried in it.
The investigation order is also fixed. Metrics → traces → logs. Metrics answer "since when, what, and how much"; traces answer "which service, which span"; and logs answer "exactly which branch it took with which values inside that." If you filter in by trace_id, the lines you have to read shrink to a few dozen.
What you will do in the next lab
In the ckad-obs namespace, you create probes in all three ways (httpGet, tcpSocket, exec), calculate and fill in the startup probe's startup budget, attach probes to a Deployment to control its readiness, and apply a PodDisruptionBudget.
In this lab environment, actually viewing logs and kubectl exec are not possible. You must know investigation commands such as kubectl logs --previous, -c, --since, --tail, kubectl exec -it POD -c CONTAINER -- sh, and kubectl debug, but you cannot run them by hand here, so they are covered in the quiz. These commands appear as they are in the exam room, so memorize the syntax exactly.