
Apache Spark — The answer to a slow job is in the plan and the event log
Transformations only stack up a plan; an action launches a job split into stages and tasks
In one line
Spark code looks like it runs from top to bottom, but in fact the driver keeps building a plan, and the moment it meets an action it turns that whole plan into a job, splits it into stages and tasks, and hands them out to the executors. What happened and when is told not by the code but by the event log.
Why it is split this way
When you first read Spark code, it is easy to think that the spark.read.csv(...) line reads the file, the filter line filters, and the count line counts. Read that way, you look for performance problems in the wrong place. The spot that seems to say "reading takes 40 seconds" is in fact where twenty transformations stacked up earlier all run at once.
Spark divides the work this way because it starts from the premise that the data does not fit in the memory of a single machine. To spread a computation over many processes, someone has to know the whole picture, cut the work into pieces and hand them out, and whoever receives a piece only has to compute its own share. The glossary in the cluster mode overview defines these roles as follows.
- Driver: the process that runs the application's main() and creates the SparkContext. It builds the plan and hands out tasks.
- Executor: a process started on a worker node for each application. It runs tasks and keeps data in memory or on disk.
- Task: the unit of work sent to a single executor.
- Job: a parallel computation made up of several tasks, created in response to one action.
- Stage: a job divided into smaller sets of tasks that depend on each other. The documentation says it is similar to the map and reduce phases of MapReduce.
The key point is that the definition of a job contains the words "in response to an action". With no action, there is no job.
How it works
The RDD programming guide states flatly that "all transformations in Spark are lazy". A transformation does not compute its result right away; it only remembers which transformation was applied, and the computation happens only when an action asks the driver for a result. The documentation also notes the benefit of this design. If Spark knows in advance that a reduce will follow a map, it can send only the reduced result back to the driver instead of a large intermediate result. The value of laziness is that you can choose the route after you have seen the destination.
df = spark.read.csv("/data/shop/orders.csv", header=True, schema=ddl)  # 계획 1줄
paid = df.filter(F.col("status") == "paid")                           # 계획 +1
big = paid.withColumn("bulk", F.col("qty") >= 5)                       # 계획 +1
big.count()      # 행동 — 여기서 잡이 뜨고, 위 세 줄이 한 번에 실행된다
When it meets an action, the driver turns the plan into a physical plan and cuts that plan at the shuffle boundaries. A stretch without a shuffle (narrow transformations such as reading, filtering and adding a column) can run back to back inside a single task, so it becomes one stage. When a wide transformation such as groupBy appears, which has to gather the same key in one place, the stage splits there, because the later stage can read the results only after every task of the earlier stage has written them as shuffle files.
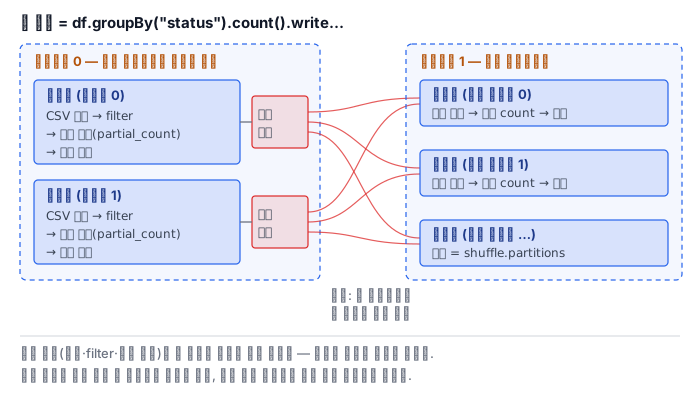
Within a stage, one partition is one task. So the number of partitions is the number of pieces that can work at the same time. When reading files, the number of partitions is not determined by file size alone. According to the performance tuning documentation, the default of the minimum number of partitions to split files into (spark.sql.files.minPartitionNum) is spark.sql.leafNodeDefaultParallelism, and the default of that value is the default parallelism of the SparkContext. This means that even a small file is split into at least as many parts as there are cores.
What is the driver and what is the executor in local mode
This lab Pod has no cluster. In the master URL table, local means one worker thread (no parallelism) and local[K] means K worker threads. In local mode, a single driver JVM also plays the role of the executor. Tasks run as threads inside that JVM.
Even so, the distinctions between driver, executor, job, stage and task remain. The code that builds the plan and the code that runs the tasks simply live in the same process. This is why learning with local mode is not wasted. The shape of the job, stage and task events recorded in the event log is the same as on a cluster. This Pod is set to local[2] with 1g of driver memory.
The event log: evidence for tracing a finished application
The driver's web UI (4040) is visible only while the application is alive. To look at a finished application, you use the History Server as described in the monitoring documentation, and the History Server rebuilds the UI from the event log the application left behind. Without an event log, there is almost nothing you can learn about a finished application.
In the event log, one line of JSON is one event. When a job starts, SparkListenerJobStart is written, and when a stage finishes, SparkListenerStageCompleted is written. So a guess like "three actions means three jobs" can be verified by counting lines.
One caution. According to the configuration documentation, the defaults in Spark 4.2 are: spark.eventLog.compress is true, the compression codec is zstd, and spark.eventLog.rolling.enabled is true. If you leave the defaults, the log is rolled into several files and compressed, so you cannot read it directly with grep. This lab has changed it to a single plain-text file. If you want to use the same approach in production, check these two settings first.
What it looks like in the field
One action is not always one job. If you read a CSV with a header row without giving a schema, Spark first launches a small job to check the header row. An action that writes files can also create more than one job. So do not count code; count the log. In this lab too, you count the jobs of the application that called three actions directly from the log instead of guessing.
Errors show up in two places. If the path is wrong, the read fails at the analysis stage the moment you call read, without waiting for an action. The name of the error condition in that case is PATH_NOT_FOUND. If the problem is a value inside the data, on the other hand, it is not known when the plan is built, and it blows up only when an action actually reads the data. With the former, the code line and the error match; with the latter, it blows up on an unrelated line (the action).
The driver dies first. If you call collect() to see the results, the entire result is gathered in one place, the driver. The RDD guide says this can overflow the driver's memory, so it recommends take when you only want to see a few elements. No matter how many executors you have, there is only one driver.
A print inside a transformation does not appear on the driver's screen. Code inside a transformation runs on the executors. In local mode it happens to be visible, but it disappears once you move to a cluster.
What really matters in practice
- A transformation is a plan, and an action makes the work happen. The slow spot is usually the line with the action, but the cause is the whole chain of transformations before it.
- Stage boundaries are shuffles. Reducing the number of stages means reducing shuffles.
- One partition is one task. The number of partitions sets the limit on how much can work at the same time.
- Do not guess the number of jobs; count it from the event log. Schema inference, header checks and writes create additional jobs.
- The event log defaults to rolling and zstd compression. Look at the settings before choosing a tool to read it.
- There is only one driver. Gathering results on the driver with collect is the most common driver memory accident.
What you will do in the next lab
After checking the version with spark-submit, you launch the first job, which counts 300,000 orders. You run an application that only stacks transformations and confirm that the event log has no job at all, and in an application that calls actions several times you count from the log how many jobs actually started. You trigger a shuffle with groupBy to see the stage split, and compare how the number of partitions of the same file differs between local[1] and local[2]. Finally, you read a path that does not exist to get the name of the error condition, and summarize your numbers in a report.