
Apache Hadoop — Stand up and run HDFS and YARN in one pod
YARN hands out memory by cutting it into container sizes
In one line
YARN cuts a cluster's memory and CPU into pieces called containers and hands them out to applications. The size of a piece has a lower limit and an upper limit: a request smaller than the lower limit is raised to it, and a request larger than the upper limit is rejected. Who gets served first is decided by the queues, and the logs of finished containers are left in one place only if you turn on log aggregation.
Why this was needed
The JobTracker of Hadoop 1 did resource management and job monitoring all by itself. As the cluster grew, this single process became a bottleneck, and the slots were divided in advance into map slots and reduce slots, so during the time only maps were running, the reduce slots sat idle. Moreover, on that cluster you could not run anything other than MapReduce.
The YARN architecture document explains this as a design that splits it in two. Resource management is handled by the ResourceManager, of which there is one per cluster, and job planning and monitoring by an ApplicationMaster started one per application. The NodeManager running on each machine starts containers and monitors and reports resource usage. The Scheduler inside the ResourceManager is, in the documentation's words, a "pure" scheduler: it only hands out resources and does not track application state or restart failed tasks. That is the AM's job. So MapReduce, Spark and other frameworks all share the same cluster by bringing only their own AM.
How it works
When you submit a job, the ResourceManager grabs the first container and starts the AM. The AM makes requests of the kind "N containers of X MB of memory and Y vcores", and the scheduler hands them out to fit the free space on the NodeManagers. Here the size rules come in. According to yarn-default.xml, they are as follows.
yarn.scheduler.minimum-allocation-mb, default 1024: a request smaller than this is raised to this value. A NodeManager configured with less memory than this is shut down by the ResourceManager.yarn.scheduler.maximum-allocation-mb, default 8192: a request larger than this is rejected withInvalidResourceRequestException.- For vcores, the minimum is 1 and the maximum is 4 by default.
The resource model documentation adds that a request may be adjusted to the minimum and maximum or changed to a multiple of the configured increment. This means the size you requested and the size you received can differ. The MapReduce AM notices in advance that a task request exceeds the maximum allocation, ends the job as KILLED before even requesting a container, and leaves the reason in the application's Diagnostics line.
The total that a NodeManager offers to containers is yarn.nodemanager.resource.memory-mb. The default -1 is computed only when hardware auto-detection is on, and otherwise it is set to 8192MB. It does not check whether the machine actually has that much memory.
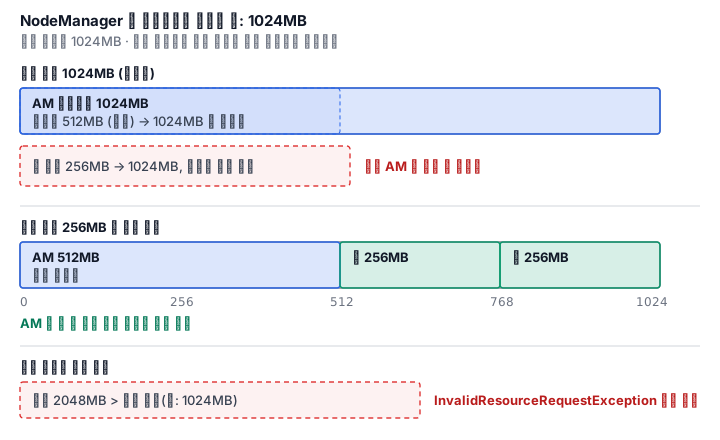
Looking at this lab Pod in numbers shows why the rules matter. The Pod memory is 2Gi, and just the heap caps of the four daemons NameNode, DataNode, ResourceManager and NodeManager add up to 864MB (256, 160, 256, 192). The share the NodeManager offers to containers is 1024MB. If you leave the minimum allocation at the default 1024MB, one container is the whole node. If the AM takes that one, there is no room for a map, and the job waits forever with only the AM started. Moreover, the default request of the MapReduce AM, yarn.app.mapreduce.am.resource.mb, is 1536MB, so it does not fit on a 1024MB node at all. On a small node, you have to lower the minimum allocation and also lower the AM and task requests together. This is why the lab image set the minimum allocation to 128MB, the maximum allocation to 1024MB, the AM to 384MB and map and reduce to 256MB.
Also remember that the request and the JVM heap play separately. mapreduce.map.memory.mb is the container size, and the heap is set inside it at a default ratio of 0.8. The remaining 20% is for the JVM itself and native memory. The NodeManager by default has both the physical memory check and the virtual memory check on (vmem-pmem-ratio 2.1) and kills a container that overflows (the lab image turned off the virtual memory check, which wrongly counts the JVM's reserved address space as usage).
Queues decide who gets served first
The default scheduler is the CapacityScheduler. According to the Capacity Scheduler documentation, every queue is a child of root, and you write the children separated by commas in yarn.scheduler.capacity.root.queues. Each queue's capacity is a percentage, and the sum on one level must be 100. This share is a guarantee, not a fence. If other queues are empty, it can use more than its share, and that elasticity is limited with maximum-capacity.
<property>
  <name>yarn.scheduler.capacity.root.queues</name>
  <value>default,etl,adhoc</value>
</property>
<property>
  <name>yarn.scheduler.capacity.root.etl.capacity</name>
  <value>60</value>
</property>
After editing the configuration file, you apply it without restarting the ResourceManager, with yarn rmadmin -refreshQueues. A job chooses its queue with mapreduce.job.queuename (default default), and a job submitted to a nonexistent queue is rejected at submission.
There is one more value that small clusters often run into. maximum-am-resource-percent is the fraction of cluster resources that can be used for AMs, 10% by default. It decides the number of simultaneously active applications. 10% of a 1024MB node is smaller than one AM, so if you submit two jobs at the same time, the second easily stays in ACCEPTED.
Logs are gathered only if you turn it on
A container's logs are left on the local disk of the NodeManager that started that container. The default of yarn.log-aggregation-enable is false, and in that case the logs are deleted after yarn.nodemanager.log.retain-seconds, 10800 seconds (3 hours) by default. If you turn it on, the logs are moved under /tmp/logs in HDFS after the app finishes, and with one line, yarn logs -applicationId <앱 ID> (where the placeholder is the application ID), you read the logs of all the containers at once. The lab image has this turned on. With hundreds of nodes, without this, finding the log of one failed task takes half a day.
How empty the cluster is right now is seen at /ws/v1/cluster/metrics of the ResourceManager REST. totalMB, allocatedMB, availableMB and appsPending come out at once.
What it looks like in the field
First, a job does not move from ACCEPTED. The cause is usually one of three. There is no node big enough for the AM, the queue's AM share is full, or the AM started but there is no room for task containers. If you put availableMB and the request size side by side, most cases are solved.
Second, you reduced the request but the memory used is unchanged. If you request less than the minimum allocation, it is raised to the minimum allocation. With a request of 256MB and a minimum of 1024MB, what you receive is 1024MB.
Third, a container dies from exceeding memory. It is the case where the heap fits within the request but the thread stacks and native buffers exceed the rest. Lower the heap ratio or raise the request.
Fourth, you deleted a queue and all the jobs are rejected. The submission script uses the default default queue, and you removed that queue from the list.
What really matters in practice
- The size you requested and the size you received are different. It is raised to the lower limit, and rejected if it exceeds the upper limit.
- The NodeManager's share does not know the real memory. At the default value, it lies with 8192MB.
- The container size is larger than the heap. By default, the heap is 0.8 of it and the rest is the JVM's own share.
- A queue's share is a guarantee, not a fence. The fence is maximum-capacity.
- Apply queue changes with refreshQueues. You do not restart.
- Log aggregation is off by default. If you do not turn it on, the evidence of a failure disappears after a few hours.
What you will do in the next lab
You read the cluster's total memory and free space through the ResourceManager's REST, and confirm from the diagnostics line of the application status that a job requesting 2048MB for one map, larger than the maximum allocation, cannot get a container and ends as KILLED. You add the etl and adhoc queues to capacity-scheduler.xml, make the sum of guaranteed shares 100, apply it with refreshQueues, and then see that a job submitted to the etl queue runs in that queue and that a job submitted to a nonexistent queue is rejected at submission. You read the queue state through the scheduler REST, fetch the aggregated logs of a finished job with yarn logs, and summarize in a report.